#NZDUSD @ 0.62580 was testing the 0.6270s in a soft US dollar environment. (Pivot Orderbook analysis)
…
This is a premium post.
[s2If !current_user_can(access_s2member_level4)]Please register for PREMIUM VERSION HERE to read full post below containing analysis. In case of any error or you think you are not able to read the full post below, please email us at support#nehcap.com [lwa][/s2If] [s2If current_user_can(access_s2member_level4)]
- NZD/USD was testing the 0.6270s in a soft US dollar environment.
- The RBNZ still have a job on its hands.
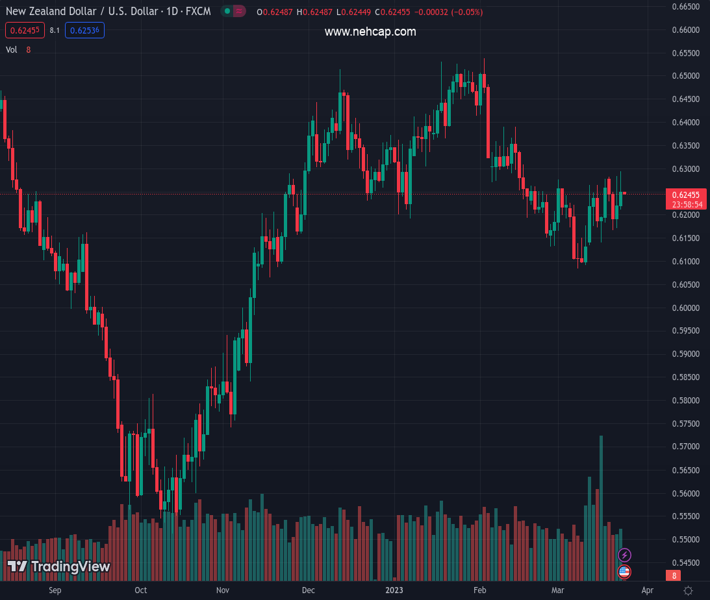
The pair currently trades last at 0.62580.
The previous day high was 0.6283 while the previous day low was 0.6171. The daily 38.2% Fib levels comes at 0.624, expected to provide support. Similarly, the daily 61.8% fib level is at 0.6214, expected to provide support.
NZD/USD is higher into the close of the New York session by some 0.5% after rallying from 0.6211 to test the bear´s commitments near 0.6300 with the price making a high of 0.6294.
´´The Kiwi held strength attained following yesterday’s Fed decision and starts the day at the upper end of March’s trading ranges, at around 0.6275,´´ analysts at ANZ Bank explained, noting yesterday’s speech by Reserve Bank of New Zealand´s Chief Economist Paul Conway.
´´While he didn’t really say anything new, media reports made it look hawkish, and to be fair, the RBNZ still have a job on their hands. But of course, so do others even if the Fed is possibly wavering. Our forecasts see Kiwi mildly higher, but we remain worried about the imbalances that bears continue to cite,´´ the analysts said.
Meanwhile, the US Dollar pared earlier losses on Thursday after the US Federal Reserve sounded close to calling time on interest rate hikes. The dollar index, DXY, which measures the currency against six major peers, is trading between 101.95 and 102.65 on the day.
Technical Levels: Supports and Resistances
NZDUSD currently trading at 0.6252 at the time of writing. Pair opened at 0.6221 and is trading with a change of 0.5 % .
| Overview | Overview.1 | |
|---|---|---|
| 0 | Today last price | 0.6252 |
| 1 | Today Daily Change | 0.0031 |
| 2 | Today Daily Change % | 0.5000 |
| 3 | Today daily open | 0.6221 |
The pair is trading above its 20 Daily moving average @ 0.6194, below its 50 Daily moving average @ 0.6304 , below its 100 Daily moving average @ 0.6275 and above its 200 Daily moving average @ 0.6162
| Trends | Trends.1 | |
|---|---|---|
| 0 | Daily SMA20 | 0.6194 |
| 1 | Daily SMA50 | 0.6304 |
| 2 | Daily SMA100 | 0.6275 |
| 3 | Daily SMA200 | 0.6162 |
The previous day high was 0.6283 while the previous day low was 0.6171. The daily 38.2% Fib levels comes at 0.624, expected to provide support. Similarly, the daily 61.8% fib level is at 0.6214, expected to provide support.
Note the levels of interest below:
- Pivot support is noted at 0.6167, 0.6113, 0.6055
- Pivot resistance is noted at 0.6279, 0.6337, 0.6391
| Levels | Levels.1 |
|---|---|
| Previous Daily High | 0.6283 |
| Previous Daily Low | 0.6171 |
| Previous Weekly High | 0.6278 |
| Previous Weekly Low | 0.6131 |
| Previous Monthly High | 0.6538 |
| Previous Monthly Low | 0.6131 |
| Daily Fibonacci 38.2% | 0.6240 |
| Daily Fibonacci 61.8% | 0.6214 |
| Daily Pivot Point S1 | 0.6167 |
| Daily Pivot Point S2 | 0.6113 |
| Daily Pivot Point S3 | 0.6055 |
| Daily Pivot Point R1 | 0.6279 |
| Daily Pivot Point R2 | 0.6337 |
| Daily Pivot Point R3 | 0.6391 |
[/s2If]
Join Our Telegram Group
")


