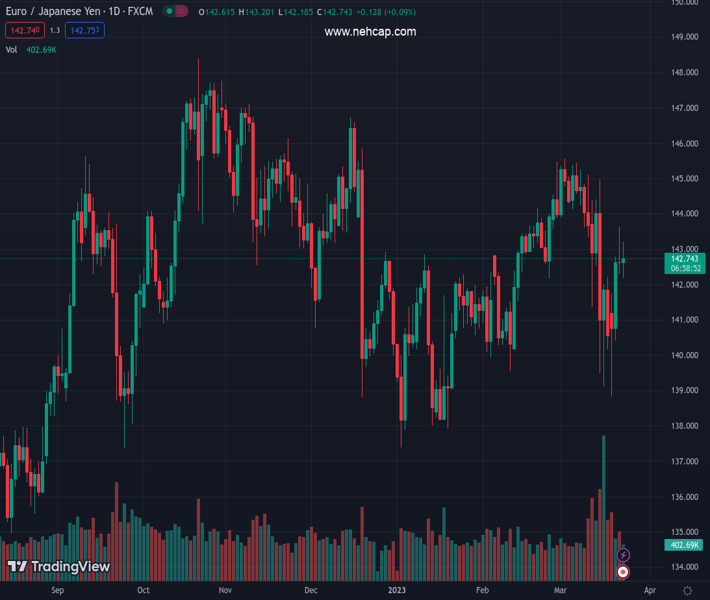
#EURJPY @ 142.751 loses some upside momentum around 143.20. (Pivot Orderbook analysis)
…
This is a premium post.
[s2If !current_user_can(access_s2member_level4)]Please register for PREMIUM VERSION HERE to read full post below containing analysis. In case of any error or you think you are not able to read the full post below, please email us at support#nehcap.com [lwa][/s2If] [s2If current_user_can(access_s2member_level4)]
- EUR/JPY loses some upside momentum around 143.20.
- Further recovery looks likely above 141.81 so far.
The pair currently trades last at 142.751.
The previous day high was 143.63 while the previous day low was 142.3. The daily 38.2% Fib levels comes at 143.12, expected to provide resistance. Similarly, the daily 61.8% fib level is at 142.81, expected to provide resistance.
EUR/JPY leaves behind Wednesday’s irresolute price action and advances past the 143.00 barrier, where it has so far met some decent resistance.
Despite the weekly rebound seems to have run out so steam, further upside should not be ruled out. Against that, the 2023 high at 145.56 (March 2) emerges as the next target of note prior to a potential visit to the December 2022 peak at 146.72 (December 15).
In the meantime, extra gains remain in store while the cross trades above the 200-day SMA, today at 141.81.
Technical Levels: Supports and Resistances
EURJPY currently trading at 142.86 at the time of writing. Pair opened at 142.71 and is trading with a change of 0.11 % .
| Overview | Overview.1 | |
|---|---|---|
| 0 | Today last price | 142.86 |
| 1 | Today Daily Change | 102.00 |
| 2 | Today Daily Change % | 0.11 |
| 3 | Today daily open | 142.71 |
The pair is trading below its 20 Daily moving average @ 143.44, above its 50 Daily moving average @ 142.17 , above its 100 Daily moving average @ 142.73 and above its 200 Daily moving average @ 141.83
| Trends | Trends.1 | |
|---|---|---|
| 0 | Daily SMA20 | 143.44 |
| 1 | Daily SMA50 | 142.17 |
| 2 | Daily SMA100 | 142.73 |
| 3 | Daily SMA200 | 141.83 |
The previous day high was 143.63 while the previous day low was 142.3. The daily 38.2% Fib levels comes at 143.12, expected to provide resistance. Similarly, the daily 61.8% fib level is at 142.81, expected to provide resistance.
Note the levels of interest below:
- Pivot support is noted at 142.13, 141.56, 140.81
- Pivot resistance is noted at 143.46, 144.2, 144.78
| Levels | Levels.1 |
|---|---|
| Previous Daily High | 143.63 |
| Previous Daily Low | 142.30 |
| Previous Weekly High | 144.96 |
| Previous Weekly Low | 139.13 |
| Previous Monthly High | 145.47 |
| Previous Monthly Low | 139.55 |
| Daily Fibonacci 38.2% | 143.12 |
| Daily Fibonacci 61.8% | 142.81 |
| Daily Pivot Point S1 | 142.13 |
| Daily Pivot Point S2 | 141.56 |
| Daily Pivot Point S3 | 140.81 |
| Daily Pivot Point R1 | 143.46 |
| Daily Pivot Point R2 | 144.20 |
| Daily Pivot Point R3 | 144.78 |
[/s2If]
Join Our Telegram Group
")


