#AUDUSD @ 0.67293 picks up bids to renew intraday high near 0.6730., @nehcap view: Limited upside expected (Pivot Orderbook analysis)
…
This is a premium post.
[s2If !current_user_can(access_s2member_level4)]Please register for PREMIUM VERSION HERE to read full post below containing analysis. In case of any error or you think you are not able to read the full post below, please email us at support#nehcap.com [lwa][/s2If] [s2If current_user_can(access_s2member_level4)]
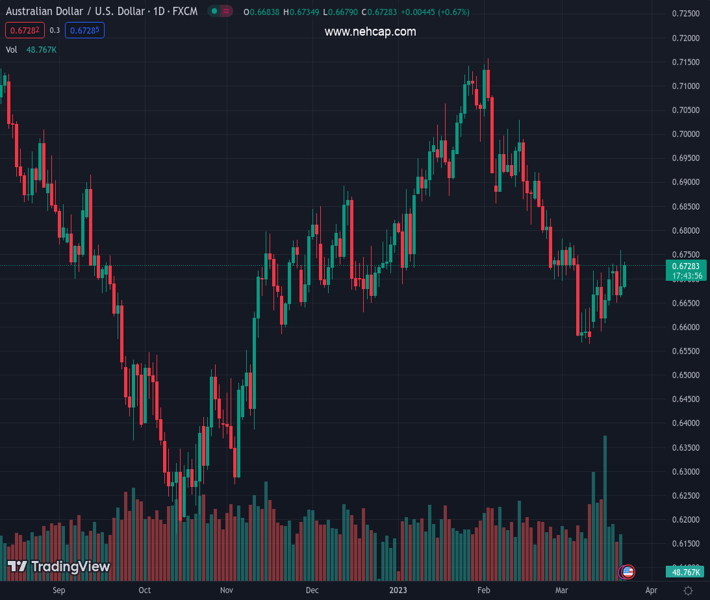
- AUD/USD picks up bids to renew intraday high near 0.6730.
- Bulls keep reins inside two-week-old rising wedge, 200-SMA adds to the upside filters.
- Upbeat RSI, sustained trend line breakout keeps buyers hopeful.
- Key SMA confluence puts a short-term floor under Aussie price.
The pair currently trades last at 0.67293.
The previous day high was 0.6759 while the previous day low was 0.6661. The daily 38.2% Fib levels comes at 0.6722, expected to provide support. Similarly, the daily 61.8% fib level is at 0.6699, expected to provide support.
AUD/USD extends the post-Fed run-up towards refreshing the intraday top near 0.6730 amid early Thursday morning in Europe. In doing so, the Aussie pair grinds higher within a two-week-old rising wedge bearish chart formation.
It’s worth noting, however, that the quote’s successful break of the previous key resistance line from early February, around 0.6620 by the press time, joins the upbeat RSI (14) line to keep the AUD/USD pair buyers hopeful.
However, the stated wedge’s top line, near 0.6760 by the press time, can challenge the Aussie pair’s immediate upside.
Even if the quote manages to cross the 0.6760 hurdle, the 200-SMA level of 0.6775 can challenge the AUD/USD bulls before giving them control.
On the flip side, a convergence of the 100-SMA and 50-SMA appears short-term strong support, around 0.6675 at the latest.
Following that, the stated wedge’s lower line and the resistance-turned-support can please the bears near 0.6660 and 0.6620.
It should be observed that the AUD/USD pair’s sustained break of 0.6660 would confirm the rising wedge bearish chart pattern suggesting the theoretical target of 0.6460.
Overall, AUD/USD is likely to remain firmer but the upside room appears limited.
Trend: Limited upside expected
Technical Levels: Supports and Resistances
AUDUSD currently trading at 0.673 at the time of writing. Pair opened at 0.6685 and is trading with a change of 0.67% % .
| Overview | Overview.1 | |
|---|---|---|
| 0 | Today last price | 0.673 |
| 1 | Today Daily Change | 0.0045 |
| 2 | Today Daily Change % | 0.67% |
| 3 | Today daily open | 0.6685 |
The pair is trading above its 20 Daily moving average @ 0.6687, below its 50 Daily moving average @ 0.6858 , below its 100 Daily moving average @ 0.6787 and below its 200 Daily moving average @ 0.6761
| Trends | Trends.1 | |
|---|---|---|
| 0 | Daily SMA20 | 0.6687 |
| 1 | Daily SMA50 | 0.6858 |
| 2 | Daily SMA100 | 0.6787 |
| 3 | Daily SMA200 | 0.6761 |
The previous day high was 0.6759 while the previous day low was 0.6661. The daily 38.2% Fib levels comes at 0.6722, expected to provide support. Similarly, the daily 61.8% fib level is at 0.6699, expected to provide support.
Note the levels of interest below:
- Pivot support is noted at 0.6644, 0.6604, 0.6547
- Pivot resistance is noted at 0.6742, 0.6799, 0.684
| Levels | Levels.1 |
|---|---|
| Previous Daily High | 0.6759 |
| Previous Daily Low | 0.6661 |
| Previous Weekly High | 0.6725 |
| Previous Weekly Low | 0.6579 |
| Previous Monthly High | 0.7158 |
| Previous Monthly Low | 0.6698 |
| Daily Fibonacci 38.2% | 0.6722 |
| Daily Fibonacci 61.8% | 0.6699 |
| Daily Pivot Point S1 | 0.6644 |
| Daily Pivot Point S2 | 0.6604 |
| Daily Pivot Point S3 | 0.6547 |
| Daily Pivot Point R1 | 0.6742 |
| Daily Pivot Point R2 | 0.6799 |
| Daily Pivot Point R3 | 0.6840 |
[/s2If]
Join Our Telegram Group
")


