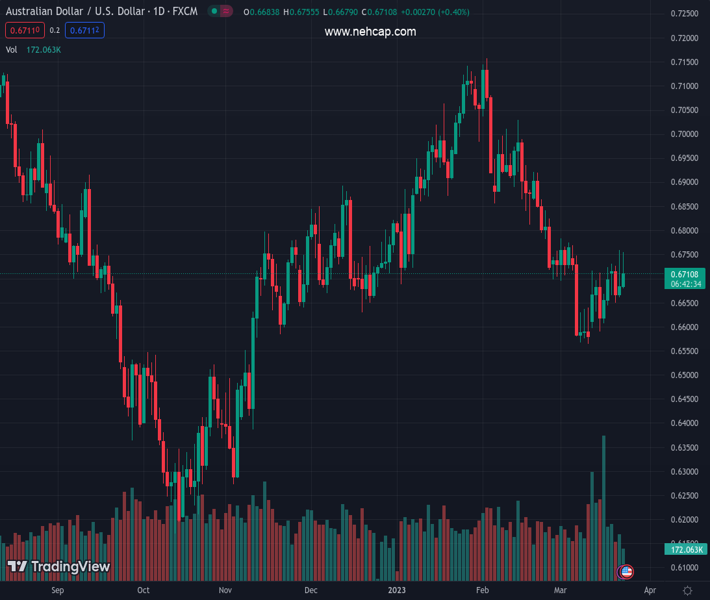
#AUDUSD @ 0.67101 Australian Dollar falls against G10 rivals during the European session. (Pivot Orderbook analysis)
…
This is a premium post.
[s2If !current_user_can(access_s2member_level4)]Please register for PREMIUM VERSION HERE to read full post below containing analysis. In case of any error or you think you are not able to read the full post below, please email us at support#nehcap.com [lwa][/s2If] [s2If current_user_can(access_s2member_level4)]
- Australian Dollar falls against G10 rivals during the European session.
- US Initial Jobless Claims drops unexpectedly, helping DXY.
- AUD/USD reverses again from 0.6750, finds support at 0.6690.
The pair currently trades last at 0.67101.
The previous day high was 0.6759 while the previous day low was 0.6661. The daily 38.2% Fib levels comes at 0.6722, expected to provide resistance. Similarly, the daily 61.8% fib level is at 0.6699, expected to provide support.
The AUD/USD was rejected again from above 0.6750 and retreat to as low as 0.6690, before bouncing back above 0.6700 after Wall Street’s opening.
Data from the US showed a larger-than-expected decline in Jobless Claims, helping the US Dollar gained some ground. Still the greenback remains under pressure after the FOMC meeting. The Federal Reserve raised it key interest rate by 25 basis points but did not commit to further rate hikes.
The US Dollar rose after the data but is weakening again after a positive opening in Wall Street. Equity prices are recovering after Wednesday’s sell-off. At the same time, US yields are moving off daily highs, adding bearish pressure to the greenback.
The Aussie was among the worst performers of the European session, with AUD/NZD reaching fresh three-day lows under 1.0700. The recovery in AUD/USD is being driven by higher equity prices and a weaker US Dollar, as the Aussie still remains weak.
From a technical perspective, AUD/USD was again rejected from above 0.6750 and pulled back. The pair is showing difficulties in extending the rally but corrections are limited, reflecting that the bullish bias is still intact.
Technical Levels: Supports and Resistances
AUDUSD currently trading at 0.6706 at the time of writing. Pair opened at 0.6685 and is trading with a change of 0.31 % .
| Overview | Overview.1 | |
|---|---|---|
| 0 | Today last price | 0.6706 |
| 1 | Today Daily Change | 0.0021 |
| 2 | Today Daily Change % | 0.3100 |
| 3 | Today daily open | 0.6685 |
The pair is trading above its 20 Daily moving average @ 0.6687, below its 50 Daily moving average @ 0.6858 , below its 100 Daily moving average @ 0.6787 and below its 200 Daily moving average @ 0.6761
| Trends | Trends.1 | |
|---|---|---|
| 0 | Daily SMA20 | 0.6687 |
| 1 | Daily SMA50 | 0.6858 |
| 2 | Daily SMA100 | 0.6787 |
| 3 | Daily SMA200 | 0.6761 |
The previous day high was 0.6759 while the previous day low was 0.6661. The daily 38.2% Fib levels comes at 0.6722, expected to provide resistance. Similarly, the daily 61.8% fib level is at 0.6699, expected to provide support.
Note the levels of interest below:
- Pivot support is noted at 0.6644, 0.6604, 0.6547
- Pivot resistance is noted at 0.6742, 0.6799, 0.684
| Levels | Levels.1 |
|---|---|
| Previous Daily High | 0.6759 |
| Previous Daily Low | 0.6661 |
| Previous Weekly High | 0.6725 |
| Previous Weekly Low | 0.6579 |
| Previous Monthly High | 0.7158 |
| Previous Monthly Low | 0.6698 |
| Daily Fibonacci 38.2% | 0.6722 |
| Daily Fibonacci 61.8% | 0.6699 |
| Daily Pivot Point S1 | 0.6644 |
| Daily Pivot Point S2 | 0.6604 |
| Daily Pivot Point S3 | 0.6547 |
| Daily Pivot Point R1 | 0.6742 |
| Daily Pivot Point R2 | 0.6799 |
| Daily Pivot Point R3 | 0.6840 |
[/s2If]
Join Our Telegram Group
")


