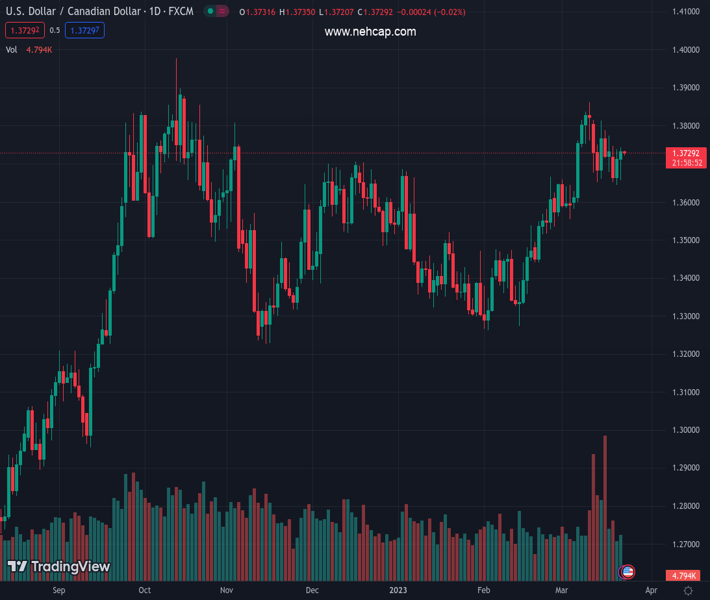
#USDCAD @ 1.37280 has reclaimed the previous day’s high around 1.3740 as Fed’s Powell rules out hopes of rate cuts in 2023. (Pivot Orderbook analysis)
…
This is a premium post.
[s2If !current_user_can(access_s2member_level4)]Please register for PREMIUM VERSION HERE to read full post below containing analysis. In case of any error or you think you are not able to read the full post below, please email us at support#nehcap.com [lwa][/s2If] [s2If current_user_can(access_s2member_level4)]
- USD/CAD has reclaimed the previous day’s high around 1.3740 as Fed’s Powell rules out hopes of rate cuts in 2023.
- The Loonie is hovering near the downward-sloping trendline of the Descending Triangle chart pattern.
- Investors should be aware of the fact that responsive selling is expected as the Loonie asset is at make-or-break levels.
The pair currently trades last at 1.37280.
The previous day high was 1.3738 while the previous day low was 1.3644. The daily 38.2% Fib levels comes at 1.3702, expected to provide support. Similarly, the daily 61.8% fib level is at 1.368, expected to provide support.
The USD/CAD pair has recovered its entire losses and has reclaimed region around Wednesday’s high at 1.3740 in the early Asian session. The Loonie asset witnessed a significant buying interest near 1.3680 as the Federal Reserve (Fed) ruled out hopes of rate cuts in 2023 citing price stability as their utmost priority.
S&P500 futures were heavily dumped by the market participants as a continuation of higher rates by the Fed would bolster the case of a recession in the United States. The continuation of severe policy tightening in times when banking turmoil is promising a cooing demand and credit tightening is assuring a dismal economic outlook.
The US Dollar Index (DXY) has turned sideways below 102.60 after a stellar recovery from 102.00 as the market participants are digesting a whole lot of commentary from Fed chair Jerome Powell.
USD/CAD is hovering near the downward-sloping trendline of the Descending Triangle chart pattern on a two-hour scale, which is plotted from March 10 high at 1.3862. While the horizontal support of the chart pattern is placed from March 14 low around 1.3652.
The Loonie asset has scaled above the 20-period Exponential Moving Averages (EMAs) at 1.3713, which indicates that the short-term trend is bullish.
Investors should be aware of the fact that responsive selling can be kicked in as the Loonie asset is at make-or-break levels.
The Relative Strength Index (RSI) (14) is hovering near 60.00. A break above the same would trigger the upside momentum.
A decisive breakdown of March 14 low at 1.3652 would drag the loonie asset toward March 07 low at 1.3600, followed by March 03 low at 1.3555.
In an alternate scenario, a confident recovery above March 14 high at 1.3773 would drive the major toward March 09 high at 1.3835 and the round-level resistance at 1.3900.
Technical Levels: Supports and Resistances
USDCAD currently trading at 1.3725 at the time of writing. Pair opened at 1.3712 and is trading with a change of 0.09 % .
| Overview | Overview.1 | |
|---|---|---|
| 0 | Today last price | 1.3725 |
| 1 | Today Daily Change | 0.0013 |
| 2 | Today Daily Change % | 0.0900 |
| 3 | Today daily open | 1.3712 |
The pair remains strongly bullish on the daily timeframe. It trades above its 20 SMA @ 1.3677, 50 SMA 1.3509, 100 SMA @ 1.3511 and 200 SMA @ 1.3348.
| Trends | Trends.1 | |
|---|---|---|
| 0 | Daily SMA20 | 1.3677 |
| 1 | Daily SMA50 | 1.3509 |
| 2 | Daily SMA100 | 1.3511 |
| 3 | Daily SMA200 | 1.3348 |
The previous day high was 1.3738 while the previous day low was 1.3644. The daily 38.2% Fib levels comes at 1.3702, expected to provide support. Similarly, the daily 61.8% fib level is at 1.368, expected to provide support.
Note the levels of interest below:
- Pivot support is noted at 1.3659, 1.3605, 1.3566
- Pivot resistance is noted at 1.3752, 1.3791, 1.3845
| Levels | Levels.1 |
|---|---|
| Previous Daily High | 1.3738 |
| Previous Daily Low | 1.3644 |
| Previous Weekly High | 1.3828 |
| Previous Weekly Low | 1.3652 |
| Previous Monthly High | 1.3666 |
| Previous Monthly Low | 1.3262 |
| Daily Fibonacci 38.2% | 1.3702 |
| Daily Fibonacci 61.8% | 1.3680 |
| Daily Pivot Point S1 | 1.3659 |
| Daily Pivot Point S2 | 1.3605 |
| Daily Pivot Point S3 | 1.3566 |
| Daily Pivot Point R1 | 1.3752 |
| Daily Pivot Point R2 | 1.3791 |
| Daily Pivot Point R3 | 1.3845 |
[/s2If]
Join Our Telegram Group
")


