#NZDUSD @ 0.62279 prints mild gains after bouncing off two-week-old ascending support line., @nehcap view: Further recovery expected (Pivot Orderbook analysis)
…
This is a premium post.
[s2If !current_user_can(access_s2member_level4)]Please register for PREMIUM VERSION HERE to read full post below containing analysis. In case of any error or you think you are not able to read the full post below, please email us at support#nehcap.com [lwa][/s2If] [s2If current_user_can(access_s2member_level4)]
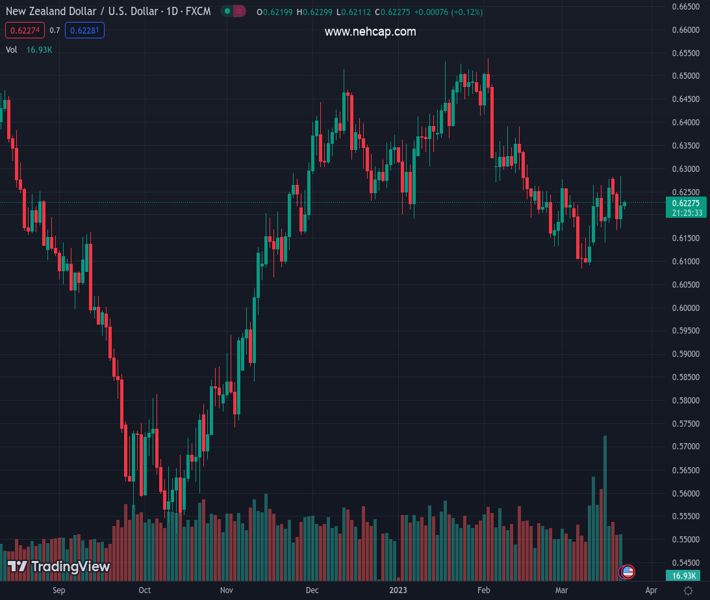
- NZD/USD prints mild gains after bouncing off two-week-old ascending support line.
- Bullish MACD signals, steady RSI (14) joins sustained trading beyond 200-DMA to favor bulls.
- 100-DMA, 50-DMA restrict short-term upside before mid-February high.
- Bears need validation from 0.6130 before challenging monthly low.
The pair currently trades last at 0.62279.
The previous day high was 0.6258 while the previous day low was 0.6167. The daily 38.2% Fib levels comes at 0.6202, expected to provide support. Similarly, the daily 61.8% fib level is at 0.6223, expected to provide support.
NZD/USD grinds higher past 0.6200, mildly bid near 0.6225 during early Thursday, as it defends the Federal Reserve (Fed) inspired gains despite the latest pullback from the 100-DMA.
In doing so, the Kiwi pair stays firmer above a fortnight-long support line, as well as the 200-DMA. Adding strength to the upside bias could be the bullish MACD signals and the firmer RSI (14).
As a result, the NZD/USD price is likely to mark another attempt in crossing the 100-DMA hurdle of 0.6280, which in turn will highlight the 50-DMA resistance surrounding the 0.6300 threshold for the Kiwi pair buyers.
In a case where the quote remains firmer past 0.6300, the odds of its run-up towards challenging the mid-February high of near 0.6390 and then to the 0.6400 round figure can’t be ruled out.
Alternatively, NZD/USD pullback remains elusive unless the quote stays beyond the aforementioned immediate support line, close to 0.6200 by the press time.
Following that, the 200-DMA level of 0.6158 and the 0.6130 level may act as the last defenses of the buyers before directing the quote toward the monthly low of 0.6084.
Overall, NZD/USD is likely to grind higher but the road toward the north appears bumpy.
Trend: Further recovery expected
Technical Levels: Supports and Resistances
NZDUSD currently trading at 0.6227 at the time of writing. Pair opened at 0.6194 and is trading with a change of 0.53% % .
| Overview | Overview.1 | |
|---|---|---|
| 0 | Today last price | 0.6227 |
| 1 | Today Daily Change | 0.0033 |
| 2 | Today Daily Change % | 0.53% |
| 3 | Today daily open | 0.6194 |
The pair is trading above its 20 Daily moving average @ 0.6193, below its 50 Daily moving average @ 0.6306 , below its 100 Daily moving average @ 0.6271 and above its 200 Daily moving average @ 0.6162
| Trends | Trends.1 | |
|---|---|---|
| 0 | Daily SMA20 | 0.6193 |
| 1 | Daily SMA50 | 0.6306 |
| 2 | Daily SMA100 | 0.6271 |
| 3 | Daily SMA200 | 0.6162 |
The previous day high was 0.6258 while the previous day low was 0.6167. The daily 38.2% Fib levels comes at 0.6202, expected to provide support. Similarly, the daily 61.8% fib level is at 0.6223, expected to provide support.
Note the levels of interest below:
- Pivot support is noted at 0.6155, 0.6115, 0.6064
- Pivot resistance is noted at 0.6246, 0.6297, 0.6337
| Levels | Levels.1 |
|---|---|
| Previous Daily High | 0.6258 |
| Previous Daily Low | 0.6167 |
| Previous Weekly High | 0.6278 |
| Previous Weekly Low | 0.6131 |
| Previous Monthly High | 0.6538 |
| Previous Monthly Low | 0.6131 |
| Daily Fibonacci 38.2% | 0.6202 |
| Daily Fibonacci 61.8% | 0.6223 |
| Daily Pivot Point S1 | 0.6155 |
| Daily Pivot Point S2 | 0.6115 |
| Daily Pivot Point S3 | 0.6064 |
| Daily Pivot Point R1 | 0.6246 |
| Daily Pivot Point R2 | 0.6297 |
| Daily Pivot Point R3 | 0.6337 |
[/s2If]
Join Our Telegram Group
")


