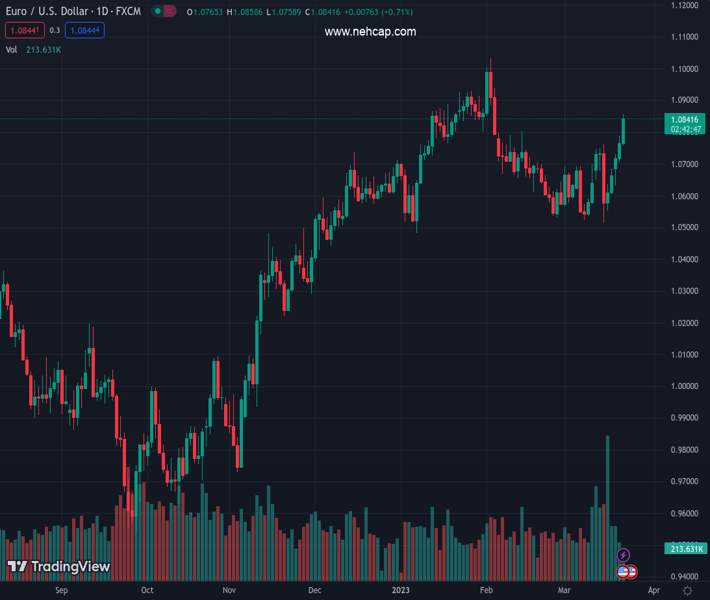
#EURUSD @ 1.08488 FOMC raises key rate by 25 bps as expected, despite recent turmoil. (Pivot Orderbook analysis)
…
This is a premium post.
[s2If !current_user_can(access_s2member_level4)]Please register for PREMIUM VERSION HERE to read full post below containing analysis. In case of any error or you think you are not able to read the full post below, please email us at support#nehcap.com [lwa][/s2If] [s2If current_user_can(access_s2member_level4)]
- FOMC raises key rate by 25 bps as expected, despite recent turmoil.
- US Dollar tumbles after FOMC statement, attention turns to Chair Powell.
- EUR/USD breaks 1.0800 and climbs toward 1.0850.
The pair currently trades last at 1.08488.
The previous day high was 1.0789 while the previous day low was 1.0704. The daily 38.2% Fib levels comes at 1.0756, expected to provide support. Similarly, the daily 61.8% fib level is at 1.0736, expected to provide support.
The EUR/USD jumped from 1.0790 to 1.0845, following the decision of the Federal Reserve (Fed) to raise interest rates by 25 bps as expected. The US Dollar tumbled as US yields dropped sharply.
The Federal Reserve (Fed) raised its key interest rate by 25 bps as expected to 4.75% -5.00%. The vote was unanimous. They dropped the forward guidance, mentioning that “some additional policy firming may be appropriate”, instead of “ongoing increases in the target range will be appropriate”. In a few minutes, Chair Powell’s press conference will begin.
The US Dollar dropped sharply boosting the EUR/USD to the upside. Markets are looking at the decisions as a “dovish hike”. Wall Street indices printed fresh highs. The improvement in risk sentiment weighs on the US dollar.
Technical Levels: Supports and Resistances
EURUSD currently trading at 1.079 at the time of writing. Pair opened at 1.0768 and is trading with a change of 0.2 % .
| Overview | Overview.1 | |
|---|---|---|
| 0 | Today last price | 1.0790 |
| 1 | Today Daily Change | 0.0022 |
| 2 | Today Daily Change % | 0.2000 |
| 3 | Today daily open | 1.0768 |
The pair remains strongly bullish on the daily timeframe. It trades above its 20 SMA @ 1.0632, 50 SMA 1.0729, 100 SMA @ 1.0586 and 200 SMA @ 1.0329.
| Trends | Trends.1 | |
|---|---|---|
| 0 | Daily SMA20 | 1.0632 |
| 1 | Daily SMA50 | 1.0729 |
| 2 | Daily SMA100 | 1.0586 |
| 3 | Daily SMA200 | 1.0329 |
The previous day high was 1.0789 while the previous day low was 1.0704. The daily 38.2% Fib levels comes at 1.0756, expected to provide support. Similarly, the daily 61.8% fib level is at 1.0736, expected to provide support.
Note the levels of interest below:
- Pivot support is noted at 1.0718, 1.0669, 1.0634
- Pivot resistance is noted at 1.0803, 1.0838, 1.0887
| Levels | Levels.1 |
|---|---|
| Previous Daily High | 1.0789 |
| Previous Daily Low | 1.0704 |
| Previous Weekly High | 1.0760 |
| Previous Weekly Low | 1.0516 |
| Previous Monthly High | 1.1033 |
| Previous Monthly Low | 1.0533 |
| Daily Fibonacci 38.2% | 1.0756 |
| Daily Fibonacci 61.8% | 1.0736 |
| Daily Pivot Point S1 | 1.0718 |
| Daily Pivot Point S2 | 1.0669 |
| Daily Pivot Point S3 | 1.0634 |
| Daily Pivot Point R1 | 1.0803 |
| Daily Pivot Point R2 | 1.0838 |
| Daily Pivot Point R3 | 1.0887 |
[/s2If]
Join Our Telegram Group
")


