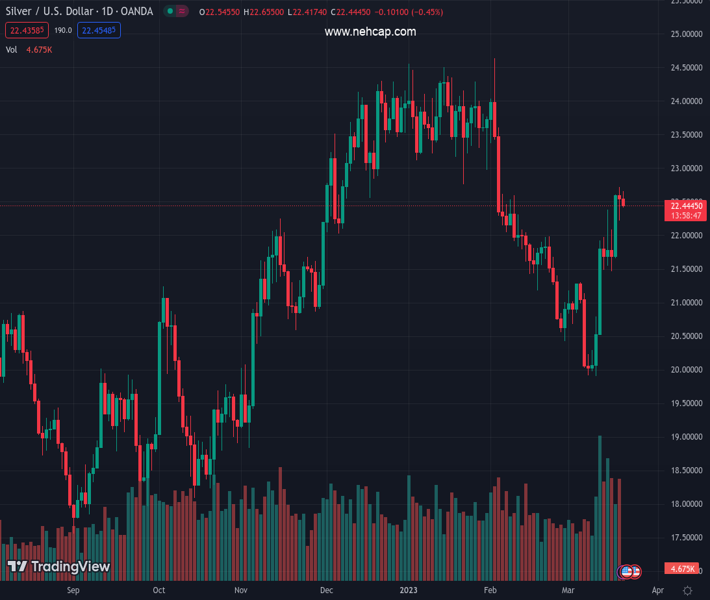
#XAGUSD @ 22.429 Silver remains on the defensive for the second straight day, albeit lacks follow-through. (Pivot Orderbook analysis)
…
This is a premium post.
[s2If !current_user_can(access_s2member_level4)]Please register for PREMIUM VERSION HERE to read full post below containing analysis. In case of any error or you think you are not able to read the full post below, please email us at support#nehcap.com [lwa][/s2If] [s2If current_user_can(access_s2member_level4)]
- Silver remains on the defensive for the second straight day, albeit lacks follow-through.
- The technical setup supports prospects for the emergence of dip-buying at lower levels.
- Bulls need to wait for a move beyond the 61.8% Fibo. level before placing fresh bets.
The pair currently trades last at 22.429.
The previous day high was 22.72 while the previous day low was 22.22. The daily 38.2% Fib levels comes at 22.41, expected to provide support. Similarly, the daily 61.8% fib level is at 22.53, expected to provide resistance.
Silver extends its consolidative price move for the second straight day on Tuesday and remains well within the striking distance of its highest level since February 3 touched the previous day. The white metal trades just below the mid-$22.00s during the early European session and still seems poised to prolong its recent appreciating move witnessed over the past two weeks or so.
The recent breakout through the $21.65-$21.70 confluence resistance was seen as a fresh trigger for bullish traders. Furthermore, a subsequent move and acceptance above the 50% Fibonacci retracement level of the recent sharp pullback from a multi-month peak further add credence to the constructive outlook. This, along with bullish oscillators on 4-hour and daily charts, suggests that the path of least resistance for the XAG/USD is to the upside.
Hence, any subsequent dip towards the overnight swing low, around the $22.20 area, which coincides with the 50$ Fibo. level, could be seen as a buying opportunity. That said, some follow-through selling below the $22.00 mark could drag the XAG/USD to the $21.65-$21.70 confluence resistance break point. This comprises the 200-period Simple Moving Average (SMA) on the 4-hour chart and the 38.2% Fibo. level, which should act as a pivotal point.
A convincing break below the latter could expose the $21.00 mark, representing the 23.6% Fibo. level. The XAG/USD might then turn vulnerable to accelerate the fall towards testing the $20.55-$20.50 intermediate support en route to the $20.00 psychological mark. The downward trajectory could get extended further towards the next relevant support near the $19.60 region.
On the flip side, the $22.70 area, or a multi-week top touched on Monday, could act as an immediate hurdle ahead of the 61.8% Fibo. level, around the $22.85 region and the $23.00 mark. Some follow-through buying will pave the way for a move towards testing the next relevant hurdle near the $23.25-$23.35 zone en route to the $24.00 round-figure mark. Bulls might then aim to challenge the multi-month top, around the $24.65 zone touched in February.
Technical Levels: Supports and Resistances
XAGUSD currently trading at 22.44 at the time of writing. Pair opened at 22.55 and is trading with a change of -0.49 % .
| Overview | Overview.1 | |
|---|---|---|
| 0 | Today last price | 22.44 |
| 1 | Today Daily Change | -0.11 |
| 2 | Today Daily Change % | -0.49 |
| 3 | Today daily open | 22.55 |
The pair remains strongly bullish on the daily timeframe. It trades above its 20 SMA @ 21.2, 50 SMA 22.31, 100 SMA @ 22.36 and 200 SMA @ 20.95.
| Trends | Trends.1 | |
|---|---|---|
| 0 | Daily SMA20 | 21.20 |
| 1 | Daily SMA50 | 22.31 |
| 2 | Daily SMA100 | 22.36 |
| 3 | Daily SMA200 | 20.95 |
The previous day high was 22.72 while the previous day low was 22.22. The daily 38.2% Fib levels comes at 22.41, expected to provide support. Similarly, the daily 61.8% fib level is at 22.53, expected to provide resistance.
Note the levels of interest below:
- Pivot support is noted at 22.28, 22.0, 21.78
- Pivot resistance is noted at 22.77, 22.99, 23.27
| Levels | Levels.1 |
|---|---|
| Previous Daily High | 22.72 |
| Previous Daily Low | 22.22 |
| Previous Weekly High | 22.61 |
| Previous Weekly Low | 20.54 |
| Previous Monthly High | 24.64 |
| Previous Monthly Low | 20.42 |
| Daily Fibonacci 38.2% | 22.41 |
| Daily Fibonacci 61.8% | 22.53 |
| Daily Pivot Point S1 | 22.28 |
| Daily Pivot Point S2 | 22.00 |
| Daily Pivot Point S3 | 21.78 |
| Daily Pivot Point R1 | 22.77 |
| Daily Pivot Point R2 | 22.99 |
| Daily Pivot Point R3 | 23.27 |
[/s2If]
Join Our Telegram Group
")


