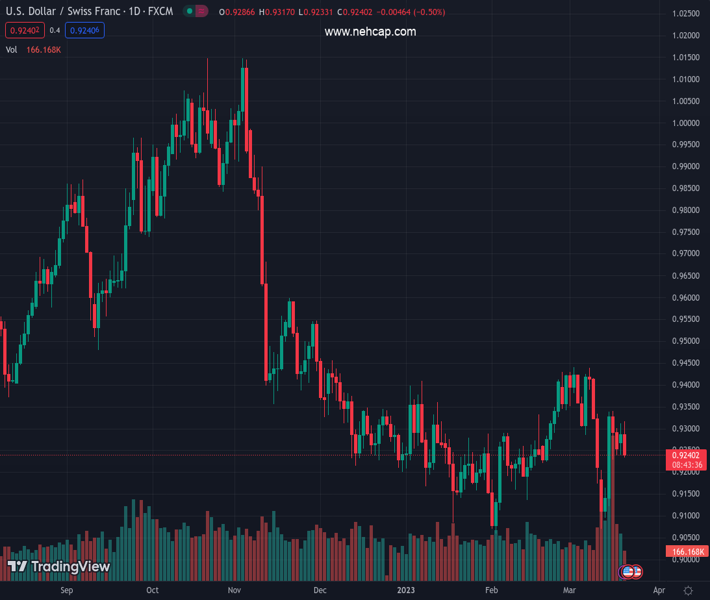
#USDCHF @ 0.92398 comes under some renewed selling pressure on Tuesday amid sustained USD selling. (Pivot Orderbook analysis)
…
This is a premium post.
[s2If !current_user_can(access_s2member_level4)]Please register for PREMIUM VERSION HERE to read full post below containing analysis. In case of any error or you think you are not able to read the full post below, please email us at support#nehcap.com [lwa][/s2If] [s2If current_user_can(access_s2member_level4)]
- USD/CHF comes under some renewed selling pressure on Tuesday amid sustained USD selling.
- Bets for a less hawkish Fed offset a further recovery in the US bond yields and weigh on the USD.
- The risk-on environment could undermine the safe-haven CHF and lend some support to the pair.
- Investors might also prefer to move to the sidelines ahead of the crucial central bank event risks.
The pair currently trades last at 0.92398.
The previous day high was 0.9312 while the previous day low was 0.924. The daily 38.2% Fib levels comes at 0.9285, expected to provide resistance. Similarly, the daily 61.8% fib level is at 0.9268, expected to provide resistance.
The USD/CHF pair attracts fresh sellers following an early uptick to the 0.9315 area on Tuesday and extends the sharp intraday downfall through the first half of the European session. The pair drops to the 0.9250-0.9245 area in the last hour and reverses a major part of the previous day’s positive move.
The Swiss Franc (CHF) draws support from the latest optimism led by the news that UBS will rescue Credit Suisse in a $3.24 billion deal, which helps ease fears of widespread contagion risk. This, along with sustained US Dollar selling for the fourth successive day amid expectations that the Federal Reserve (Fed) will soften its hawkish stance, is seen exerting downward pressure on the USD/CHF pair.
In fact, the markets have been pricing in a smaller 25 bps rate hike in March and the possibility that the US central bank might even start cutting rates during the second half of the year. This, to a larger extent, offsets a further recovery in the US Treasury bond yields and drags the USD Index, which tracks the Greenback against a basket of currencies, to its lowest level since February 14 in the last hour.
It, however, remains to be seen if bears can maintain their dominant position amid a generally positive tone around the equity markets, which tends to undermine the safe-haven CHF. Traders might also refrain from placing aggressive directional bets and prefer to wait for the outcome of the highly-anticipated two-day FOMC monetary policy meeting, scheduled to be announced during the US session on Wednesday.
The key focus, however, will remain on the accompanying policy statement and updated economic projections. This, along with Fed Chair Jerome Powell’s comments at the post-meeting press conference, will be closely scrutinized for clues about the future rate-hike path. This, in turn, will influence the USD and provide a fresh impetus to the USD/CHF pair ahead of the Swiss National Bank (SNB) meeting on Thursday.
Technical Levels: Supports and Resistances
USDCHF currently trading at 0.9254 at the time of writing. Pair opened at 0.9291 and is trading with a change of -0.4 % .
| Overview | Overview.1 | |
|---|---|---|
| 0 | Today last price | 0.9254 |
| 1 | Today Daily Change | -0.0037 |
| 2 | Today Daily Change % | -0.4000 |
| 3 | Today daily open | 0.9291 |
The pair remains strongly bearish on the daily time frame. It trades below the 20 SMA @ 0.9321, 50 SMA 0.926, 100 SMA @ 0.9359 and 200 SMA @ 0.9543.
| Trends | Trends.1 | |
|---|---|---|
| 0 | Daily SMA20 | 0.9321 |
| 1 | Daily SMA50 | 0.9260 |
| 2 | Daily SMA100 | 0.9359 |
| 3 | Daily SMA200 | 0.9543 |
The previous day high was 0.9312 while the previous day low was 0.924. The daily 38.2% Fib levels comes at 0.9285, expected to provide resistance. Similarly, the daily 61.8% fib level is at 0.9268, expected to provide resistance.
Note the levels of interest below:
- Pivot support is noted at 0.925, 0.9209, 0.9178
- Pivot resistance is noted at 0.9322, 0.9353, 0.9393
| Levels | Levels.1 |
|---|---|
| Previous Daily High | 0.9312 |
| Previous Daily Low | 0.9240 |
| Previous Weekly High | 0.9342 |
| Previous Weekly Low | 0.9072 |
| Previous Monthly High | 0.9429 |
| Previous Monthly Low | 0.9059 |
| Daily Fibonacci 38.2% | 0.9285 |
| Daily Fibonacci 61.8% | 0.9268 |
| Daily Pivot Point S1 | 0.9250 |
| Daily Pivot Point S2 | 0.9209 |
| Daily Pivot Point S3 | 0.9178 |
| Daily Pivot Point R1 | 0.9322 |
| Daily Pivot Point R2 | 0.9353 |
| Daily Pivot Point R3 | 0.9393 |
[/s2If]
Join Our Telegram Group
")


