#EURUSD @ 1.07135 snaps three-day winning streak with mild losses., @nehcap view: Pullback expected (Pivot Orderbook analysis)
…
This is a premium post.
[s2If !current_user_can(access_s2member_level4)]Please register for PREMIUM VERSION HERE to read full post below containing analysis. In case of any error or you think you are not able to read the full post below, please email us at support#nehcap.com [lwa][/s2If] [s2If current_user_can(access_s2member_level4)]
- EUR/USD snaps three-day winning streak with mild losses.
- Convergence of 200-SMA, weekly support line appears a tough nut to crack for bears before retaking control.
- Euro buyers need validation from five-week-old resistance line to keep the reins.
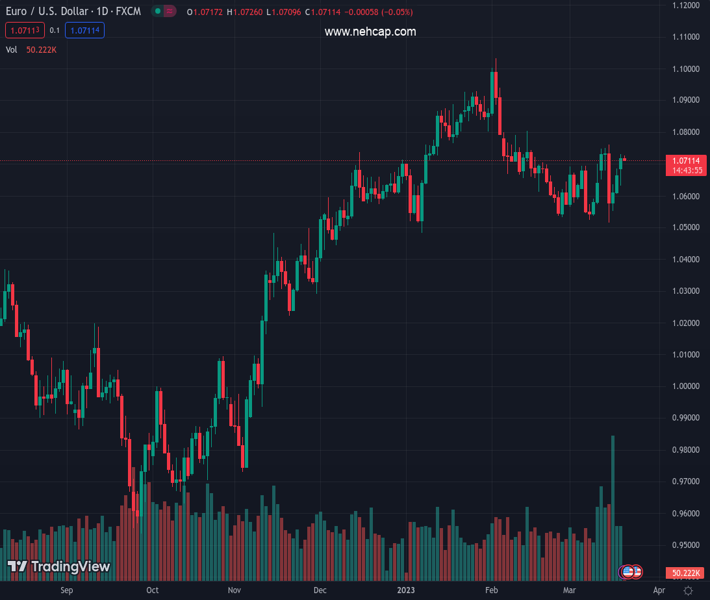
The pair currently trades last at 1.07135.
The previous day high was 1.0731 while the previous day low was 1.0631. The daily 38.2% Fib levels comes at 1.0693, expected to provide support. Similarly, the daily 61.8% fib level is at 1.0669, expected to provide support.
EUR/USD struggles to defend the 1.0700 threshold, printing mild losses heading into Tuesday’s European session, as it snaps a three-day uptrend.
The Euro pair’s pullback joins the RSI (14) line’s retreat and receding bullish bias of the MACD signals to suggest further downside.
However, the 200-SMA and an ascending trend line from the last Wednesday, around 1.0660, appear strong support for the bears to break before ushering further.
In a case where the EUR/USD price drops below 1.0660, multiple supports may test the bears around 1.0540 and 1.0525 before highlighting the monthly low of 1.0516.
Additionally, the quote’s weakness past 1.0516 could direct sellers to aim for January’s low surrounding 1.0480 for further dominance.
Meanwhile, EUR/USD recovery remains elusive unless crossing a one-month-old descending resistance line, around 1.0750 at the latest.
Following that, the monthly high and mid-February peak, respectively around 1.0760 and 1.0805, could challenge the Euro pair’s further upside.
Should the quote remains firmer past 1.0805, the odds of witnessing a run-up to refresh the Year-To-Date (YTD) high, currently around 1.1035 can’t be ruled out.
Overall, EUR/USD is likely to witness a short-term pullback but the bears are far from retaking control.
Trend: Pullback expected
Technical Levels: Supports and Resistances
EURUSD currently trading at 1.0716 at the time of writing. Pair opened at 1.072 and is trading with a change of -0.04% % .
| Overview | Overview.1 | |
|---|---|---|
| 0 | Today last price | 1.0716 |
| 1 | Today Daily Change | -0.0004 |
| 2 | Today Daily Change % | -0.04% |
| 3 | Today daily open | 1.072 |
The pair is trading above its 20 Daily moving average @ 1.0626, below its 50 Daily moving average @ 1.0728 , above its 100 Daily moving average @ 1.0577 and above its 200 Daily moving average @ 1.0327
| Trends | Trends.1 | |
|---|---|---|
| 0 | Daily SMA20 | 1.0626 |
| 1 | Daily SMA50 | 1.0728 |
| 2 | Daily SMA100 | 1.0577 |
| 3 | Daily SMA200 | 1.0327 |
The previous day high was 1.0731 while the previous day low was 1.0631. The daily 38.2% Fib levels comes at 1.0693, expected to provide support. Similarly, the daily 61.8% fib level is at 1.0669, expected to provide support.
Note the levels of interest below:
- Pivot support is noted at 1.0658, 1.0595, 1.0558
- Pivot resistance is noted at 1.0757, 1.0794, 1.0857
| Levels | Levels.1 |
|---|---|
| Previous Daily High | 1.0731 |
| Previous Daily Low | 1.0631 |
| Previous Weekly High | 1.0760 |
| Previous Weekly Low | 1.0516 |
| Previous Monthly High | 1.1033 |
| Previous Monthly Low | 1.0533 |
| Daily Fibonacci 38.2% | 1.0693 |
| Daily Fibonacci 61.8% | 1.0669 |
| Daily Pivot Point S1 | 1.0658 |
| Daily Pivot Point S2 | 1.0595 |
| Daily Pivot Point S3 | 1.0558 |
| Daily Pivot Point R1 | 1.0757 |
| Daily Pivot Point R2 | 1.0794 |
| Daily Pivot Point R3 | 1.0857 |
[/s2If]
Join Our Telegram Group
")


