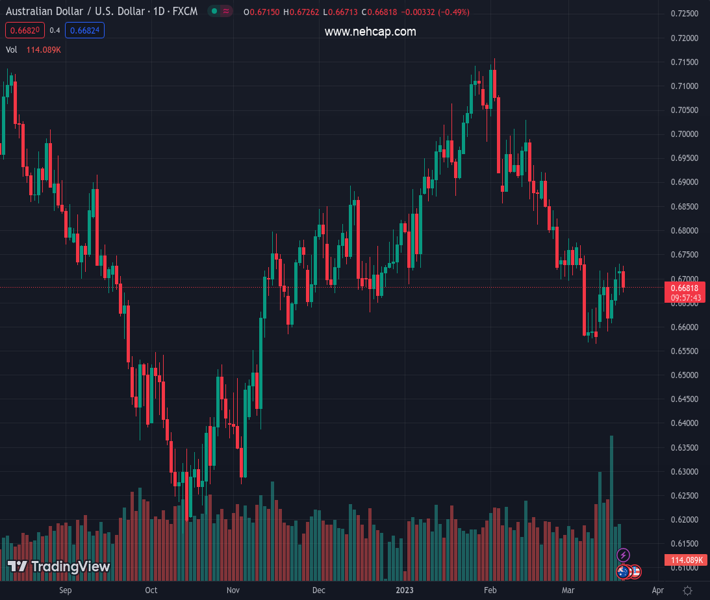
#AUDUSD @ 0.66825 retreats from a nearly two-week high in reaction to the dovish RBA meeting minutes. (Pivot Orderbook analysis)
…
This is a premium post.
[s2If !current_user_can(access_s2member_level4)]Please register for PREMIUM VERSION HERE to read full post below containing analysis. In case of any error or you think you are not able to read the full post below, please email us at support#nehcap.com [lwa][/s2If] [s2If current_user_can(access_s2member_level4)]
- AUD/USD retreats from a nearly two-week high in reaction to the dovish RBA meeting minutes.
- A further recovery in the US bond yields lends support to the USD and contributes to the slide.
- Bets for a less hawkish Fed cap the upside for the Greenback amid a generally positive risk tone.
The pair currently trades last at 0.66825.
The previous day high was 0.673 while the previous day low was 0.6666. The daily 38.2% Fib levels comes at 0.6706, expected to provide resistance. Similarly, the daily 61.8% fib level is at 0.669, expected to provide resistance.
The AUD/USD pair comes under heavy selling pressure on Tuesday and snaps a three-day winning streak to a nearly two-week high, around the 0.6730 area touched the previous day. The pair maintains its offered tone through the first half of the European session and is currently placed around the 0.6675-0.6670 region, down nearly 0.70% for the day.
The Australian Dollar weakens a bit in reaction to the release of the dovish-sounding Reserve Bank of Australia (RBA) meeting minutes, which indicated that a pause in the rate-hiking cycle may be on the cards next month. The Australian central bank, however, warned that it will continue to do whatever is necessary to bring inflation back into line, though did little to impress bulls or lend any support to the AUD/USD pair. This, along with a modest US Dollar bounce from a five-week low touched on Monday, further contributes to the offered tone surrounding the major.
A further recovery in the US Treasury bond yields – bolstered by easing fears of a widespread contagion risk – turns out to be a key factor lending some support to the USD. That said, firming expectations for a less aggressive policy tightening by the Federal Reserve (Fed) could cap any meaningful upside for the US bond yields. Apart from this, a generally positive risk tone, supported by the news that UBS will rescue Credit Suisse in a $3.24 billion deal, keeps a lid on the safe-haven Greenback and might help limit deeper losses for the risk-sensitive Aussie, at least for the time being.
Traders might also refrain from placing aggressive bets and prefer to move to the sidelines ahead of the highly-anticipated two-day FOMC meeting, starting this Tuesday. The Fed will announce its decision on Wednesday and is widely expected to deliver a smaller 25 bps rate hike. Market participants also expect that the US central bank might even cut rates during the second half of the year. Hence, investors will look for fresh clues about the Fed’s future rate-hike path, which will influence the near-term USD price dynamics and determine the near-term trajectory for the AUD/USD pair.
Heading into the key central bank event risk, traders on Tuesday might take cues from the release of the US Existing Home Sales data, due later during the early North American session. This, along with the US bond yields, will drive the USD demand and provide some impetus to the AUD/USD pair. Apart from this, the broader risk sentiment could further contribute to producing short-term opportunities.
Technical Levels: Supports and Resistances
AUDUSD currently trading at 0.6673 at the time of writing. Pair opened at 0.6719 and is trading with a change of -0.68 % .
| Overview | Overview.1 | |
|---|---|---|
| 0 | Today last price | 0.6673 |
| 1 | Today Daily Change | -0.0046 |
| 2 | Today Daily Change % | -0.6800 |
| 3 | Today daily open | 0.6719 |
The pair remains strongly bearish on the daily time frame. It trades below the 20 SMA @ 0.6702, 50 SMA 0.6867, 100 SMA @ 0.6781 and 200 SMA @ 0.6764.
| Trends | Trends.1 | |
|---|---|---|
| 0 | Daily SMA20 | 0.6702 |
| 1 | Daily SMA50 | 0.6867 |
| 2 | Daily SMA100 | 0.6781 |
| 3 | Daily SMA200 | 0.6764 |
The previous day high was 0.673 while the previous day low was 0.6666. The daily 38.2% Fib levels comes at 0.6706, expected to provide resistance. Similarly, the daily 61.8% fib level is at 0.669, expected to provide resistance.
Note the levels of interest below:
- Pivot support is noted at 0.668, 0.6641, 0.6616
- Pivot resistance is noted at 0.6744, 0.6769, 0.6808
| Levels | Levels.1 |
|---|---|
| Previous Daily High | 0.6730 |
| Previous Daily Low | 0.6666 |
| Previous Weekly High | 0.6725 |
| Previous Weekly Low | 0.6579 |
| Previous Monthly High | 0.7158 |
| Previous Monthly Low | 0.6698 |
| Daily Fibonacci 38.2% | 0.6706 |
| Daily Fibonacci 61.8% | 0.6690 |
| Daily Pivot Point S1 | 0.6680 |
| Daily Pivot Point S2 | 0.6641 |
| Daily Pivot Point S3 | 0.6616 |
| Daily Pivot Point R1 | 0.6744 |
| Daily Pivot Point R2 | 0.6769 |
| Daily Pivot Point R3 | 0.6808 |
[/s2If]
Join Our Telegram Group
")


