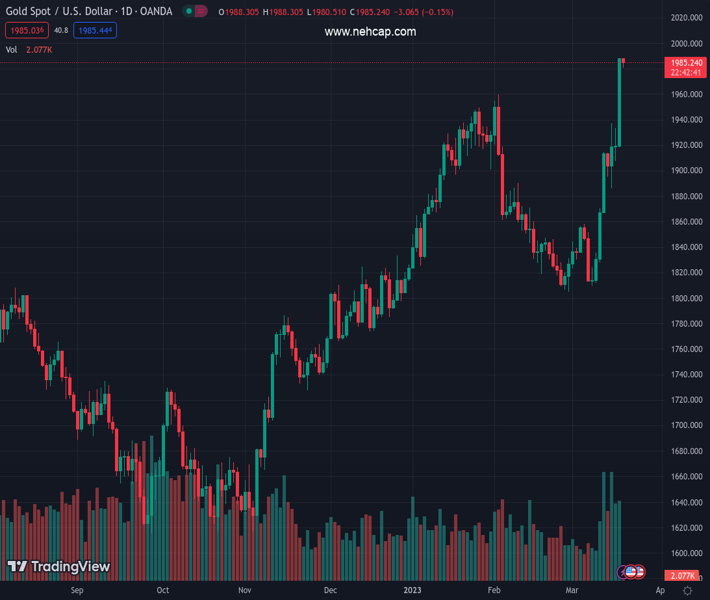
#XAUUSD @ 1,998.00 Gold price has printed a fresh 11-month high at $1,988.33 as it is being treated as a safe-haven amid the banking fiasco. (Pivot Orderbook analysis)
…
This is a premium post.
[s2If !current_user_can(access_s2member_level4)]Please register for PREMIUM VERSION HERE to read full post below containing analysis. In case of any error or you think you are not able to read the full post below, please email us at support#nehcap.com [lwa][/s2If] [s2If current_user_can(access_s2member_level4)]
- Gold price has printed a fresh 11-month high at $1,988.33 as it is being treated as a safe-haven amid the banking fiasco.
- Fed policymakers are tied to go extremely hawkish as they are required to restore investors’ confidence.
- Gold price is further approaching the horizontal resistance plotted around $2,070.54.
The pair currently trades last at 1998.00.
The previous day high was 1989.51 while the previous day low was 1918.31. The daily 38.2% Fib levels comes at 1962.31, expected to provide support. Similarly, the daily 61.8% fib level is at 1945.51, expected to provide support.
Gold price (XAU/USD) printed a fresh 11-month high at $1,988.33 on Friday. The precious metal is approaching the psychological resistance of $2,000.00 and is expected to test soon as the odds of an unchanged interest rate policy by the Federal Reserve (Fed) have accelerated dramatically.
The odds of a steady monetary policy have got more limelight as January’s inflation data has resulted in a one-time blip, February’s Consumer Price Index (CPI) has shown that it is in a declining trend, and now Fed policymakers have a responsibility of restoring investors’ confidence in the United States economy after the commercial banks’ fiasco.
As per the CME Fedwatch tool, investors are now expecting the possibility of an unchanged monetary policy with 38% chances while the rest are favoring a 25 basis point (bps) interest rate hike by Fed chair Jerome Powell to 4.75-5.00%.
S&P500 futures were heavily beaten on Friday as investors are worried about banking sector turmoil. In times of banking shakedown, investors are considering Gold as a safe-haven asset. The US Dollar Index (DXY) found intermediate support around 103.65, however further downside looks solid as Fed policymakers are tied to go extremely hawkish in the interest rate decision to be delivered on Wednesday.
In a recent poll by Reuters, 76 of 82 economists believe that the US Federal Reserve (Fed) would raise its policy rate by 25 basis points to the range of 4.75-5% following the March FOMC meeting
Gold price has delivered a breakout of the horizontal resistance plotted from the February 02 high at $1,959.80, which has turned support on a daily scale. The asset is riding the Bollinger Bands (20,2), which indicates a sheer strength in the Gold bulls.
The precious metal is further approaching the horizontal resistance plotted from the 08 March 2022 high at $2,070.54.
Meanwhile, the Relative Strength Index (RSI) (14) is oscillating in the bullish range of 60.00-80.00, which indicates that the upside momentum is extremely solid.
Technical Levels: Supports and Resistances
XAUUSD currently trading at 1989.46 at the time of writing. Pair opened at 1989.46 and is trading with a change of 0.0 % .
| Overview | Overview.1 | |
|---|---|---|
| 0 | Today last price | 1989.46 |
| 1 | Today Daily Change | 0.00 |
| 2 | Today Daily Change % | 0.00 |
| 3 | Today daily open | 1989.46 |
The pair remains strongly bullish on the daily timeframe. It trades above its 20 SMA @ 1856.42, 50 SMA 1879.63, 100 SMA @ 1824.16 and 200 SMA @ 1776.95.
| Trends | Trends.1 | |
|---|---|---|
| 0 | Daily SMA20 | 1856.42 |
| 1 | Daily SMA50 | 1879.63 |
| 2 | Daily SMA100 | 1824.16 |
| 3 | Daily SMA200 | 1776.95 |
The previous day high was 1989.51 while the previous day low was 1918.31. The daily 38.2% Fib levels comes at 1962.31, expected to provide support. Similarly, the daily 61.8% fib level is at 1945.51, expected to provide support.
Note the levels of interest below:
- Pivot support is noted at 1942.01, 1894.56, 1870.81
- Pivot resistance is noted at 2013.21, 2036.96, 2084.41
| Levels | Levels.1 |
|---|---|
| Previous Daily High | 1989.51 |
| Previous Daily Low | 1918.31 |
| Previous Weekly High | 1989.51 |
| Previous Weekly Low | 1867.66 |
| Previous Monthly High | 1959.80 |
| Previous Monthly Low | 1804.76 |
| Daily Fibonacci 38.2% | 1962.31 |
| Daily Fibonacci 61.8% | 1945.51 |
| Daily Pivot Point S1 | 1942.01 |
| Daily Pivot Point S2 | 1894.56 |
| Daily Pivot Point S3 | 1870.81 |
| Daily Pivot Point R1 | 2013.21 |
| Daily Pivot Point R2 | 2036.96 |
| Daily Pivot Point R3 | 2084.41 |
[/s2If]
Join Our Telegram Group
")


