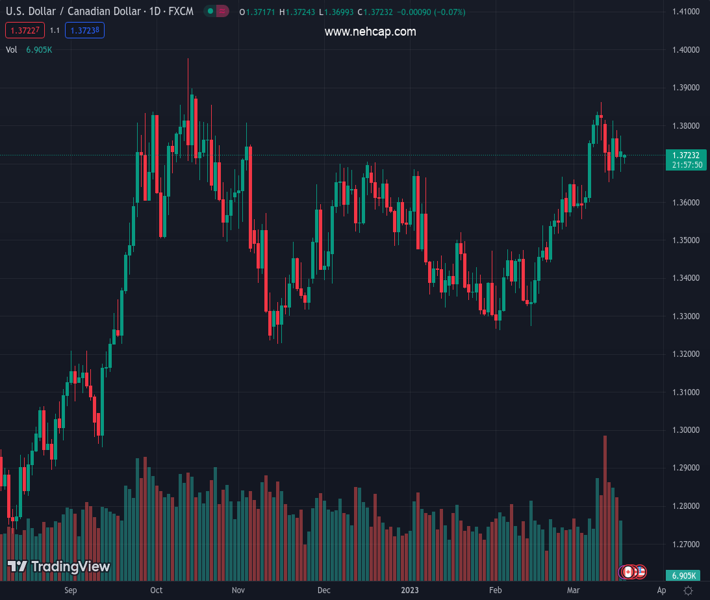
#USDCAD @ 1.37270 is expressing volatility contraction ahead of Fed inflation and Canada’s inflation. (Pivot Orderbook analysis)
…
This is a premium post.
[s2If !current_user_can(access_s2member_level4)]Please register for PREMIUM VERSION HERE to read full post below containing analysis. In case of any error or you think you are not able to read the full post below, please email us at support#nehcap.com [lwa][/s2If] [s2If current_user_can(access_s2member_level4)]
- USD/CAD is expressing volatility contraction ahead of Fed inflation and Canada’s inflation.
- The USD Index has corrected further to 103.65 as the Fed is expected to go light on interest rates.
- A 40.00-60.00 range oscillation by the RSI (14) indicates that investors are awaiting a fresh trigger for further action.
The pair currently trades last at 1.37270.
The previous day high was 1.3773 while the previous day low was 1.3678. The daily 38.2% Fib levels comes at 1.3737, expected to provide resistance. Similarly, the daily 61.8% fib level is at 1.3714, expected to provide support.
The USD/CAD pair has found a cushion around 1.3700 after a marginal correction in the Asian session. The Loonie asset is showing an expression of volatility contraction as investors are awaiting the release of Canada’s Consumer Price Index (CPI) data and the interest rate decision by the Federal Reserve (Fed), which will release on Tuesday and Wednesday respectively.
The option for an unchanged monetary policy decision by the Federal Reserve (Fed) is gaining the limelight as banking shakedown in the United States has impacted the confidence of investors dramatically.
Meanwhile, the US Dollar Index (DXY) has corrected further to 103.65 as the Fed is expected to go light on interest rates. S&P500 futures have shown a recovery move after a bearish Friday’s settlement, however, investors’ risk appetite for US equities is extremely weak.
On the Canadian Dollar front, investors are awaiting Tuesday’s Canada inflation data. As per the consensus, the headline Consumer Price Index (CPI) is expected to accelerate by 0.4%, lower than the former release of 0.5%. This might drag the annual headline CPI further to 5.5%. Also, the annual core CPI is expected to trim to 4.6% from the former release of 5.0%.
USD/CAD is auctioning in a Symmetrical Triangle chart pattern on an hourly scale, which indicates a sheer volatility contraction followed by an expansion in the same. The downward-sloping trendline of the chart pattern is plotted from March 10 high at 1.3862 while the upward-sloping trendline is placed from March 14 low at 1.3657.
Overlapping 20-period Exponential Moving Average (EMA) at 1.3724 with the asset price indicates a consolidation ahead.
Adding to that, a 40.00-60.00 range oscillation by the Relative Strength Index (RSI) (14) indicates that investors are awaiting a new trigger for further action.
A decisive breakdown of March 14 low at 1.3652 would drag the loonie asset toward March 07 low at 1.3600, followed by March 03 low at 1.3555.
In an alternate scenario, a confident recovery above March 14 high at 1.3773 would drive the major toward March 09 high at 1.3835 and the round-level resistance at 1.3900.
Technical Levels: Supports and Resistances
USDCAD currently trading at 1.3717 at the time of writing. Pair opened at 1.3729 and is trading with a change of -0.09 % .
| Overview | Overview.1 | |
|---|---|---|
| 0 | Today last price | 1.3717 |
| 1 | Today Daily Change | -0.0012 |
| 2 | Today Daily Change % | -0.0900 |
| 3 | Today daily open | 1.3729 |
The pair remains strongly bullish on the daily timeframe. It trades above its 20 SMA @ 1.3658, 50 SMA 1.3497, 100 SMA @ 1.351 and 200 SMA @ 1.334.
| Trends | Trends.1 | |
|---|---|---|
| 0 | Daily SMA20 | 1.3658 |
| 1 | Daily SMA50 | 1.3497 |
| 2 | Daily SMA100 | 1.3510 |
| 3 | Daily SMA200 | 1.3340 |
The previous day high was 1.3773 while the previous day low was 1.3678. The daily 38.2% Fib levels comes at 1.3737, expected to provide resistance. Similarly, the daily 61.8% fib level is at 1.3714, expected to provide support.
Note the levels of interest below:
- Pivot support is noted at 1.368, 1.3631, 1.3585
- Pivot resistance is noted at 1.3776, 1.3822, 1.3872
| Levels | Levels.1 |
|---|---|
| Previous Daily High | 1.3773 |
| Previous Daily Low | 1.3678 |
| Previous Weekly High | 1.3828 |
| Previous Weekly Low | 1.3652 |
| Previous Monthly High | 1.3666 |
| Previous Monthly Low | 1.3262 |
| Daily Fibonacci 38.2% | 1.3737 |
| Daily Fibonacci 61.8% | 1.3714 |
| Daily Pivot Point S1 | 1.3680 |
| Daily Pivot Point S2 | 1.3631 |
| Daily Pivot Point S3 | 1.3585 |
| Daily Pivot Point R1 | 1.3776 |
| Daily Pivot Point R2 | 1.3822 |
| Daily Pivot Point R3 | 1.3872 |
[/s2If]
Join Our Telegram Group
")


