#NZDUSD @ 0.62580 is struggling in extending its upside above 0.6280 ahead of the PBoC policy. (Pivot Orderbook analysis)
…
This is a premium post.
[s2If !current_user_can(access_s2member_level4)]Please register for PREMIUM VERSION HERE to read full post below containing analysis. In case of any error or you think you are not able to read the full post below, please email us at support#nehcap.com [lwa][/s2If] [s2If current_user_can(access_s2member_level4)]
- NZD/USD is struggling in extending its upside above 0.6280 ahead of the PBoC policy.
- To provide assistance to the economic recovery agenda, PBoC might remain dovish on interest rates.
- Rising expectations for a steady monetary policy by the Fed are restoring the confidence of investors in US equities.
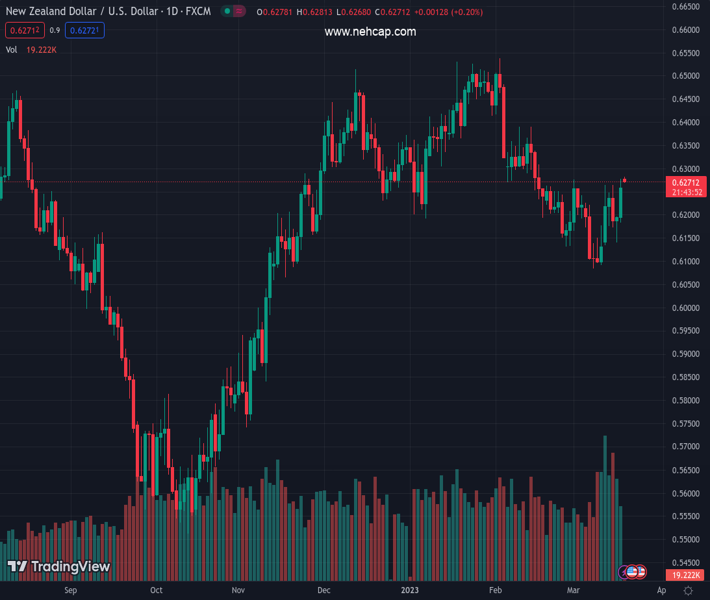
The pair currently trades last at 0.62580.
The previous day high was 0.6278 while the previous day low was 0.6178. The daily 38.2% Fib levels comes at 0.624, expected to provide support. Similarly, the daily 61.8% fib level is at 0.6216, expected to provide support.
The NZD/USD pair is facing barriers in extending its upside above the immediate resistance of 0.6280 in the early Asian session. The Kiwi asset is expected to remain on the tenterhooks as investors are awaiting the release of the interest rate decision by the People’s Bank of China (PBoC) for further action.
To provide assistance to the economic recovery agenda in the Chinese economy, PBoC might remain dovish on interest rates. Economist at UOB Group suggests that the PBoC could reduce the Loan Prime Rate (LPR) at its next meeting on March 20. They further added, “With the need for further support measures toward the real economy and for 5Y loan prime rate (LPR) to fall further to boost demand for homes, we see the possibility for the 1Y LPR to fall to 3.55% and 5Y LPR to 4.20% in Mar, following the National People’s Congress (NPC).”
It is worth noting that New Zealand is one of the leading trading partners of China and a dovish policy by the PBoC would also be supportive of the New Zealand Dollar.
Meanwhile, the position of NZ current account deficit is impacting its long-term worthiness. Data released last week showed that the current account deficit blew out to 8.9% of Gross Domestic Product (GDP) in 2022 as the nation imported more goods and services than it exported. While S&P had forecast the deficit would be 6.7% in June last year and ease to 5.8% by mid-2023.
Bloomberg reported, “New Zealand’s credit grades with S&P Global Ratings could come under pressure if the nation’s current account deficit remains too big.”
S&P500 futures are showing decent gains in the early Tokyo session after settling last week with significant losses, portraying a minor optimism in the overall risk-aversion theme. Rising expectations for a steady monetary policy by the Federal Reserve (Fed) are restoring the confidence of investors in United States equities. The US Dollar Index (DXY) has also attempted a recovery move from 103.65, however, the upside looks capped led by the banking sector’s debacle.
Technical Levels: Supports and Resistances
NZDUSD currently trading at 0.627 at the time of writing. Pair opened at 0.6269 and is trading with a change of 0.02 % .
| Overview | Overview.1 | |
|---|---|---|
| 0 | Today last price | 0.6270 |
| 1 | Today Daily Change | 0.0001 |
| 2 | Today Daily Change % | 0.0200 |
| 3 | Today daily open | 0.6269 |
The pair is trading above its 20 Daily moving average @ 0.6194, below its 50 Daily moving average @ 0.6313 , above its 100 Daily moving average @ 0.6263 and above its 200 Daily moving average @ 0.6162
| Trends | Trends.1 | |
|---|---|---|
| 0 | Daily SMA20 | 0.6194 |
| 1 | Daily SMA50 | 0.6313 |
| 2 | Daily SMA100 | 0.6263 |
| 3 | Daily SMA200 | 0.6162 |
The previous day high was 0.6278 while the previous day low was 0.6178. The daily 38.2% Fib levels comes at 0.624, expected to provide support. Similarly, the daily 61.8% fib level is at 0.6216, expected to provide support.
Note the levels of interest below:
- Pivot support is noted at 0.6205, 0.6141, 0.6105
- Pivot resistance is noted at 0.6305, 0.6342, 0.6406
| Levels | Levels.1 |
|---|---|
| Previous Daily High | 0.6278 |
| Previous Daily Low | 0.6178 |
| Previous Weekly High | 0.6278 |
| Previous Weekly Low | 0.6131 |
| Previous Monthly High | 0.6538 |
| Previous Monthly Low | 0.6131 |
| Daily Fibonacci 38.2% | 0.6240 |
| Daily Fibonacci 61.8% | 0.6216 |
| Daily Pivot Point S1 | 0.6205 |
| Daily Pivot Point S2 | 0.6141 |
| Daily Pivot Point S3 | 0.6105 |
| Daily Pivot Point R1 | 0.6305 |
| Daily Pivot Point R2 | 0.6342 |
| Daily Pivot Point R3 | 0.6406 |
[/s2If]
Join Our Telegram Group
")


