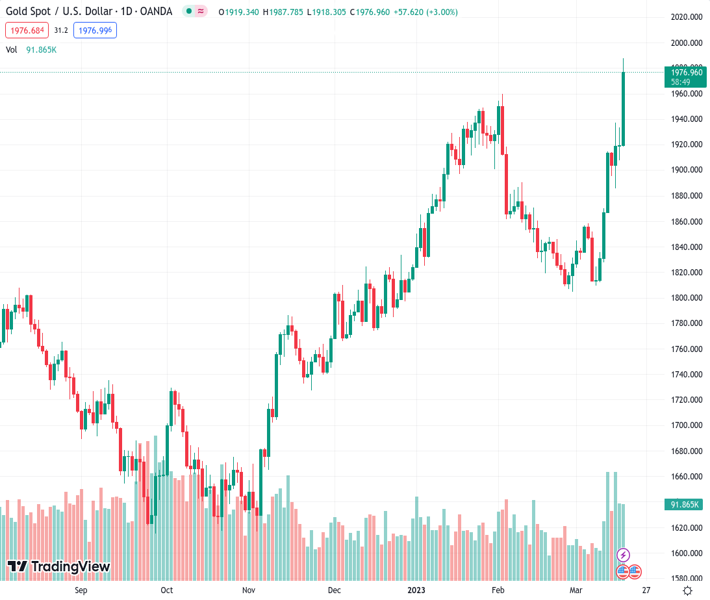
#XAUUSD @ 1,976.40 Gold price surged on Friday, extending weekly gains to over $100. (Pivot Orderbook analysis)
…
This is a premium post.
[s2If !current_user_can(access_s2member_level4)]Please register for PREMIUM VERSION HERE to read full post below containing analysis. In case of any error or you think you are not able to read the full post below, please email us at support#nehcap.com [lwa][/s2If] [s2If current_user_can(access_s2member_level4)]
- Gold price surged on Friday, extending weekly gains to over $100.
- New context of lower yields and banking jitters boost gold’s demand.
- XAU/USD eye best week in years.
The pair currently trades last at 1976.40.
The previous day high was 1933.51 while the previous day low was 1907.56. The daily 38.2% Fib levels comes at 1923.6, expected to provide support. Similarly, the daily 61.8% fib level is at 1917.47, expected to provide support.
Gold price moved further to the upside during the American sessions, breaking above $1,980. Late on Friday, XAU/USD stands at $1,982 the highest level since April 2022 and on its way to the third-highest weekly close on record.
From the level it had a week ago, the yellow metal is up by 6.3%. A sharp reversal in Treasury yields is driving the rally in Gold price. Bonds are having the week in years. Financial turmoil weighed on monetary policy expectations and the economic outlook.
Next week the Federal Reserve will announce its decision. A 25 basis point rate hike is expected. A few days ago analysts were asking 25 or 50 after US inflation and employment data. The new scenario includes the odds of a pause at the upcoming meeting. Things have changed dramatically, triggering an impressive rally in XAU/USD.
Seen Gold price above $2,000 next week looks likely. Even when price moves consistently to the upside, it makes sharp corrections. In the current context, traders should take extra caution.
Technical Levels: Supports and Resistances
XAUUSD currently trading at 1983.23 at the time of writing. Pair opened at 1919.51 and is trading with a change of 3.32 % .
| Overview | Overview.1 | |
|---|---|---|
| 0 | Today last price | 1983.23 |
| 1 | Today Daily Change | 63.72 |
| 2 | Today Daily Change % | 3.32 |
| 3 | Today daily open | 1919.51 |
The pair remains strongly bullish on the daily timeframe. It trades above its 20 SMA @ 1849.04, 50 SMA 1877.18, 100 SMA @ 1820.71 and 200 SMA @ 1776.37.
| Trends | Trends.1 | |
|---|---|---|
| 0 | Daily SMA20 | 1849.04 |
| 1 | Daily SMA50 | 1877.18 |
| 2 | Daily SMA100 | 1820.71 |
| 3 | Daily SMA200 | 1776.37 |
The previous day high was 1933.51 while the previous day low was 1907.56. The daily 38.2% Fib levels comes at 1923.6, expected to provide support. Similarly, the daily 61.8% fib level is at 1917.47, expected to provide support.
Note the levels of interest below:
- Pivot support is noted at 1906.88, 1894.24, 1880.93
- Pivot resistance is noted at 1932.83, 1946.14, 1958.78
| Levels | Levels.1 |
|---|---|
| Previous Daily High | 1933.51 |
| Previous Daily Low | 1907.56 |
| Previous Weekly High | 1870.09 |
| Previous Weekly Low | 1809.46 |
| Previous Monthly High | 1959.80 |
| Previous Monthly Low | 1804.76 |
| Daily Fibonacci 38.2% | 1923.60 |
| Daily Fibonacci 61.8% | 1917.47 |
| Daily Pivot Point S1 | 1906.88 |
| Daily Pivot Point S2 | 1894.24 |
| Daily Pivot Point S3 | 1880.93 |
| Daily Pivot Point R1 | 1932.83 |
| Daily Pivot Point R2 | 1946.14 |
| Daily Pivot Point R3 | 1958.78 |
[/s2If]
Join Our Telegram Group
")


