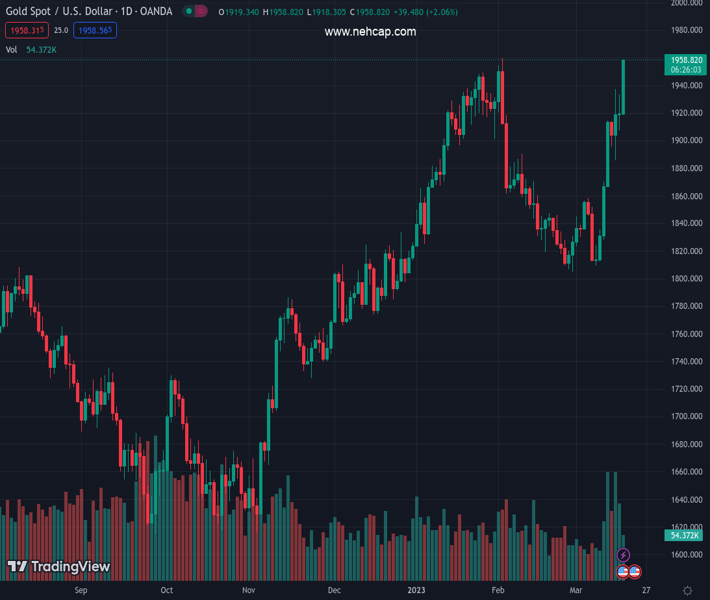
#XAUUSD @ 1,957.07 Gold price regains strong positive traction on Friday and rallies to its highest level since February. (Pivot Orderbook analysis)
…
This is a premium post.
[s2If !current_user_can(access_s2member_level4)]Please register for PREMIUM VERSION HERE to read full post below containing analysis. In case of any error or you think you are not able to read the full post below, please email us at support#nehcap.com [lwa][/s2If] [s2If current_user_can(access_s2member_level4)]
- Gold price regains strong positive traction on Friday and rallies to its highest level since February.
- Fears of a global banking crisis weigh on investors’ sentiment and lift the safe-haven XAU/USD.
- Bets for a less hawkish Fed, tumbling US bond yields, a weaker USD provide an additional boost.
The pair currently trades last at 1957.07.
The previous day high was 1933.51 while the previous day low was 1907.56. The daily 38.2% Fib levels comes at 1923.6, expected to provide support. Similarly, the daily 61.8% fib level is at 1917.47, expected to provide support.
Gold price catches fresh bids following the previous day’s directionless price action and builds on its intraday positive move through the early North American session. The XAU/USD spikes to a fresh six-week high, around the $1,946 region, in the last hour and remains on track to register its biggest weekly gain since mid-November.
A fresh wave of the global risk-aversion trade – as depicted by renewed selling around the equity markets – boosts demand for traditional safe-haven assets and benefits Gold price. Despite multi-billion-dollar lifelines for troubled banks in the United States (US) and Europe, investors are still trying to determine whether the risk of a full-blown global banking crisis has been tamed and remain concerned about the widespread contagion. Adding to this, looming recession risks take a toll on the risk sentiment and drive haven flows towards the precious metal.
Furthermore, a steep decline in the US Treasury bond yields is seen as another factor that benefits the non-yielding Gold price and remains supportive of the strong intraday rally. The anti-risk flow, along with rising bets for a smaller 25 basis points (bps) rate hike at the upcoming Federal Open Market Committee (FOMC) meeting on March 21-22, drag the US bond yields lower. Investors now seem convinced that the Fed will adopt a less hawkish stance in the wake of last week’s collapse of two mid-size US banks – Silicon Valley Bank and Signature Bank.
Meanwhile, diminishing odds for more aggressive policy tightening by the US central bank, along with tumbling US bond yields, keep the US Dollar (USD) depressed for the second straight day. A weaker Greenback provides an additional boost to the US Dollar-denominated Gold price, taking along some short-term trading stops near the previous weekly/monthly high around the $1,937 area. This might have already set the stage for a further near-term appreciating move towards the $1,959-$1,960 region, or the multi-month top touched in February.
Technical Levels: Supports and Resistances
XAUUSD currently trading at 1949.52 at the time of writing. Pair opened at 1919.51 and is trading with a change of 1.56 % .
| Overview | Overview.1 | |
|---|---|---|
| 0 | Today last price | 1949.52 |
| 1 | Today Daily Change | 30.01 |
| 2 | Today Daily Change % | 1.56 |
| 3 | Today daily open | 1919.51 |
The pair remains strongly bullish on the daily timeframe. It trades above its 20 SMA @ 1849.04, 50 SMA 1877.18, 100 SMA @ 1820.71 and 200 SMA @ 1776.37.
| Trends | Trends.1 | |
|---|---|---|
| 0 | Daily SMA20 | 1849.04 |
| 1 | Daily SMA50 | 1877.18 |
| 2 | Daily SMA100 | 1820.71 |
| 3 | Daily SMA200 | 1776.37 |
The previous day high was 1933.51 while the previous day low was 1907.56. The daily 38.2% Fib levels comes at 1923.6, expected to provide support. Similarly, the daily 61.8% fib level is at 1917.47, expected to provide support.
Note the levels of interest below:
- Pivot support is noted at 1906.88, 1894.24, 1880.93
- Pivot resistance is noted at 1932.83, 1946.14, 1958.78
| Levels | Levels.1 |
|---|---|
| Previous Daily High | 1933.51 |
| Previous Daily Low | 1907.56 |
| Previous Weekly High | 1870.09 |
| Previous Weekly Low | 1809.46 |
| Previous Monthly High | 1959.80 |
| Previous Monthly Low | 1804.76 |
| Daily Fibonacci 38.2% | 1923.60 |
| Daily Fibonacci 61.8% | 1917.47 |
| Daily Pivot Point S1 | 1906.88 |
| Daily Pivot Point S2 | 1894.24 |
| Daily Pivot Point S3 | 1880.93 |
| Daily Pivot Point R1 | 1932.83 |
| Daily Pivot Point R2 | 1946.14 |
| Daily Pivot Point R3 | 1958.78 |
[/s2If]
Join Our Telegram Group
")


