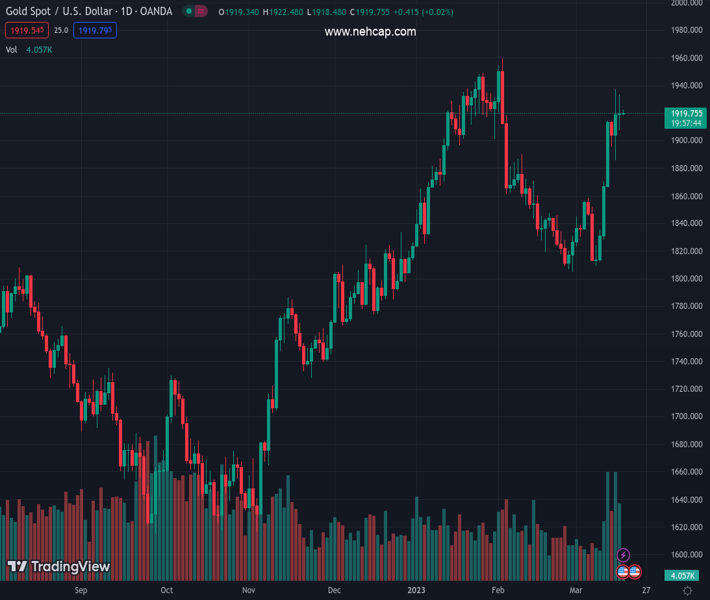
#XAUUSD @ 1,919.77 Gold price is showing volatility contraction as investors have mixed responses to Fed’s policy outlook. (Pivot Orderbook analysis)
…
This is a premium post.
[s2If !current_user_can(access_s2member_level4)]Please register for PREMIUM VERSION HERE to read full post below containing analysis. In case of any error or you think you are not able to read the full post below, please email us at support#nehcap.com [lwa][/s2If] [s2If current_user_can(access_s2member_level4)]
- Gold price is showing volatility contraction as investors have mixed responses to Fed’s policy outlook.
- The street believes that the reason behind deepening fears of the banking crisis is the Fed’s steepest and fastest rate hikes.
- Gold price is auctioning in a Symmetrical Triangle chart pattern, which indicates a squeeze in volatility.
The pair currently trades last at 1919.77.
The previous day high was 1933.51 while the previous day low was 1907.56. The daily 38.2% Fib levels comes at 1923.6, expected to provide resistance. Similarly, the daily 61.8% fib level is at 1917.47, expected to provide support.
Gold price (XAU/USD) is demonstrating a sheer squeeze in volatility amid the puzzle for monetary policy outlook by the Federal Reserve (Fed), which will be announced next week. The policy puzzle is getting more confusing as First Republic Bank has come under scrutiny after the collapse of Silicon Valley Bank (SVB) and Signature Bank.
Federal Reserve executes its monetary policy through commercial banks, which are going through a rough phase and investors are worried that more burden of higher rates would lead to more banks’ debacles.
The street believes that the reason behind deepening fears of a banking crisis is the steepest and fastest interest rate hikes from the Fed. Therefore, the odds of an unchanged monetary policy have stemmed. However, the CME Fedwatch tool is showing mere 20% chances that Fed chair Jerome Powell would keep interest rates steady.
S&P500 futures are showing nominal losses in the Asian session after a super-bullish Thursday, however, the risk appetite is still solid. The US Dollar Index (DXY) continues to juggle around 104.40 as investors are awaiting the preliminary Michigan Consumer Sentiment Index (March) data. A steady number is anticipated at 67.0. Meanwhile, the return generated on the 10-year US Treasury bonds looks sticky at around 3.58%.
Gold price is auctioning in a Symmetrical Triangle chart pattern on an hourly scale, which indicates a squeeze in volatility that is followed by an expansion in the same. The downward-sloping trendline of the aforementioned chart pattern is placed from March 15 high around $1,939.40 while the upward-sloping trendline is placed from March 16 low at $1,907.56.
Overlapping 20-period Exponential Moving Average (EMA) at $1,919.60 with the asset indicates a rangebound move.
Adding to that, the Relative Strength Index (RSI) (14) is oscillating in the 40.00-60.00 range, which indicates that investors are awaiting a potential trigger for further action.
Technical Levels: Supports and Resistances
XAUUSD currently trading at 1919.66 at the time of writing. Pair opened at 1919.51 and is trading with a change of 0.01 % .
| Overview | Overview.1 | |
|---|---|---|
| 0 | Today last price | 1919.66 |
| 1 | Today Daily Change | 0.15 |
| 2 | Today Daily Change % | 0.01 |
| 3 | Today daily open | 1919.51 |
The pair remains strongly bullish on the daily timeframe. It trades above its 20 SMA @ 1849.04, 50 SMA 1877.18, 100 SMA @ 1820.71 and 200 SMA @ 1776.37.
| Trends | Trends.1 | |
|---|---|---|
| 0 | Daily SMA20 | 1849.04 |
| 1 | Daily SMA50 | 1877.18 |
| 2 | Daily SMA100 | 1820.71 |
| 3 | Daily SMA200 | 1776.37 |
The previous day high was 1933.51 while the previous day low was 1907.56. The daily 38.2% Fib levels comes at 1923.6, expected to provide resistance. Similarly, the daily 61.8% fib level is at 1917.47, expected to provide support.
Note the levels of interest below:
- Pivot support is noted at 1906.88, 1894.24, 1880.93
- Pivot resistance is noted at 1932.83, 1946.14, 1958.78
| Levels | Levels.1 |
|---|---|
| Previous Daily High | 1933.51 |
| Previous Daily Low | 1907.56 |
| Previous Weekly High | 1870.09 |
| Previous Weekly Low | 1809.46 |
| Previous Monthly High | 1959.80 |
| Previous Monthly Low | 1804.76 |
| Daily Fibonacci 38.2% | 1923.60 |
| Daily Fibonacci 61.8% | 1917.47 |
| Daily Pivot Point S1 | 1906.88 |
| Daily Pivot Point S2 | 1894.24 |
| Daily Pivot Point S3 | 1880.93 |
| Daily Pivot Point R1 | 1932.83 |
| Daily Pivot Point R2 | 1946.14 |
| Daily Pivot Point R3 | 1958.78 |
[/s2If]
Join Our Telegram Group
")


