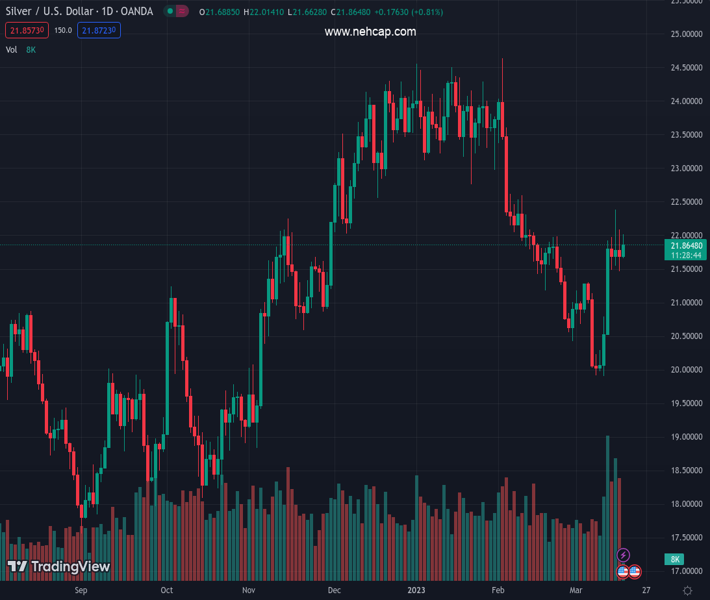
#XAGUSD @ 21.855 Silver regains positive traction on Friday, though remains in a multi-day-old trading range. (Pivot Orderbook analysis)
…
This is a premium post.
[s2If !current_user_can(access_s2member_level4)]Please register for PREMIUM VERSION HERE to read full post below containing analysis. In case of any error or you think you are not able to read the full post below, please email us at support#nehcap.com [lwa][/s2If] [s2If current_user_can(access_s2member_level4)]
- Silver regains positive traction on Friday, though remains in a multi-day-old trading range.
- Acceptance above the $21.65-$21.70 confluence supports prospects for additional gains.
- A convincing break below the $21.00 mark is needed to negate the near-term positive bias.
The pair currently trades last at 21.855.
The previous day high was 22.1 while the previous day low was 21.47. The daily 38.2% Fib levels comes at 21.71, expected to provide support. Similarly, the daily 61.8% fib level is at 21.86, expected to provide resistance.
Silver attracts fresh buying on the last day of the week and maintains its bid tone through the first half of the European session, though struggles to capitalize on the move beyond the $22.00 round-figure mark.
From a technical perspective, the two-way price moves in a familiar range witnessed over the past few sessions constitute the formation of a rectangle. Against the backdrop of the recent strong recovery from sub-$20.00 levels, or a four-month low touched last week, this might still be categorized as a bullish consolidation phase. Furthermore, acceptance above the $21.65-$21.70 confluence adds credence to the positive outlook and supports prospects for a further near-term appreciating move for the XAG/USD.
The aforementioned area comprises the 200-period Simple Moving Average (SMA) on the 4-hour chart and the 38.2% Fibonacci retracement level of the downfall from the $24.65 area, or a multi-month peak touched in February. This should now act as a strong base for the XAG/USD and help limit the immediate downside. That said, some follow-through selling, leading to a break below the trading range support near the mid-$21.00s, might negate the positive outlook and pave the way for a slide towards the $21.00 mark.
The latter coincides with the 23.6% Fibo. level, which if broken decisively will shift the near-term bias back in favour of bearish traders. The XAG/USD might then turn vulnerable to accelerate the slide towards the $20.55-$20.50 intermediate support en route to the $20.00 psychological mark. The downward trajectory could get extended further and drag spot prices to the next relevant support near the $19.60 region. The white metal could eventually drop to the $19.00 mark for the first time since early November 2022.
On the flip side, momentum back above the $22.00 round figure might confront stiff resistance near the $22.25-$22.35 region, marking the 50% Fibo. level and the overnight swing high. The subsequent move up could push the XAG/USD beyond the $22.55-$22.60 supply zone, towards testing the 61.8% Fibo. level, just ahead of the $23.00 mark. A sustained strength beyond the latter will be seen as a fresh trigger for bullish traders and should pave the way for a meaningful upside for the white metal in the near term.
Technical Levels: Supports and Resistances
XAGUSD currently trading at 21.87 at the time of writing. Pair opened at 21.7 and is trading with a change of 0.78 % .
| Overview | Overview.1 | |
|---|---|---|
| 0 | Today last price | 21.87 |
| 1 | Today Daily Change | 0.17 |
| 2 | Today Daily Change % | 0.78 |
| 3 | Today daily open | 21.70 |
The pair is trading above its 20 Daily moving average @ 21.12, below its 50 Daily moving average @ 22.36 , below its 100 Daily moving average @ 22.29 and above its 200 Daily moving average @ 20.94
| Trends | Trends.1 | |
|---|---|---|
| 0 | Daily SMA20 | 21.12 |
| 1 | Daily SMA50 | 22.36 |
| 2 | Daily SMA100 | 22.29 |
| 3 | Daily SMA200 | 20.94 |
The previous day high was 22.1 while the previous day low was 21.47. The daily 38.2% Fib levels comes at 21.71, expected to provide support. Similarly, the daily 61.8% fib level is at 21.86, expected to provide resistance.
Note the levels of interest below:
- Pivot support is noted at 21.42, 21.13, 20.79
- Pivot resistance is noted at 22.04, 22.38, 22.66
| Levels | Levels.1 |
|---|---|
| Previous Daily High | 22.10 |
| Previous Daily Low | 21.47 |
| Previous Weekly High | 21.31 |
| Previous Weekly Low | 19.90 |
| Previous Monthly High | 24.64 |
| Previous Monthly Low | 20.42 |
| Daily Fibonacci 38.2% | 21.71 |
| Daily Fibonacci 61.8% | 21.86 |
| Daily Pivot Point S1 | 21.42 |
| Daily Pivot Point S2 | 21.13 |
| Daily Pivot Point S3 | 20.79 |
| Daily Pivot Point R1 | 22.04 |
| Daily Pivot Point R2 | 22.38 |
| Daily Pivot Point R3 | 22.66 |
[/s2If]
Join Our Telegram Group
")


