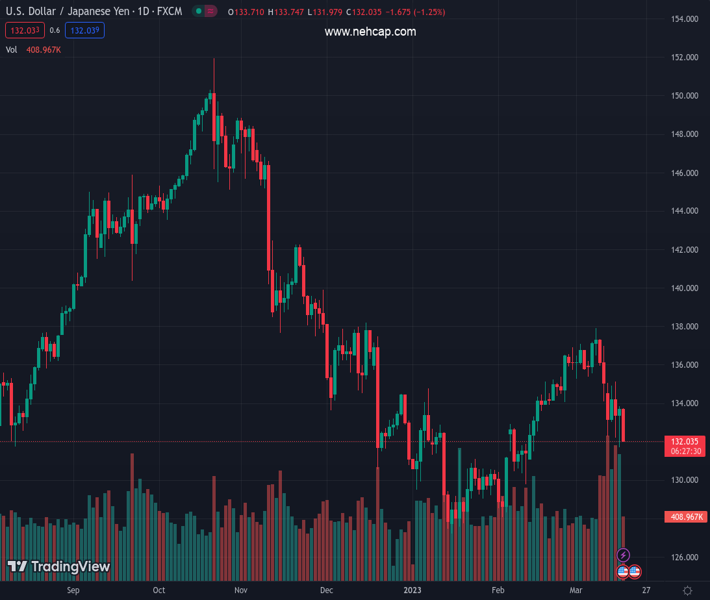
#USDJPY @ 132.064 Japanese Yen gains momentum as US Yields and Wall Street futures drop. (Pivot Orderbook analysis)
…
This is a premium post.
[s2If !current_user_can(access_s2member_level4)]Please register for PREMIUM VERSION HERE to read full post below containing analysis. In case of any error or you think you are not able to read the full post below, please email us at support#nehcap.com [lwa][/s2If] [s2If current_user_can(access_s2member_level4)]
- Japanese Yen gains momentum as US Yields and Wall Street futures drop.
- US Industrial Production stagnates in February against expectations of a 0.2% increase.
- USD/JPY heads for the third weekly loss in a row, and to the lowest daily close in a month.
The pair currently trades last at 132.064.
The previous day high was 133.82 while the previous day low was 131.72. The daily 38.2% Fib levels comes at 133.02, expected to provide resistance. Similarly, the daily 61.8% fib level is at 132.52, expected to provide resistance.
The USD/JPY dropped further, falling to as low as 131.99, as Treasury Bonds rally. A firm break below 132.00 could trigger an acceleration to the downside.
US yields are falling on Friday. The US 10-year yield dropped to 3.45% while the 2-year yield stands at 4.06%, down 2.40%, for the day. The decline in yields takes place as US stocks opened lower as markets remain anxious.
Data released in the US showed Industrial Production rose 0% in February against expectations of a 0.2% increase. January’s numbers were revised higher from 0% to 0.3%. Capacity Utilization remains at 78%. Later on Friday, the University of Michigan will release its Consumer Sentiment report.
Lower yields and a decline in stocks in boosting the Japanese Yen across the board. USD/JPY lost more than a hundred pips during the last three hours. The pair fell from above 133.00 to 131.99.
As of writing, USD/JPY trades at 132.30, under pressure and looking at the 132.00 mark. A consolidation below would point to further weakness. The next strong barrier is seen at 130.60.
Technical Levels: Supports and Resistances
USDJPY currently trading at 132.43 at the time of writing. Pair opened at 133.73 and is trading with a change of -0.97 % .
| Overview | Overview.1 | |
|---|---|---|
| 0 | Today last price | 132.43 |
| 1 | Today Daily Change | -1.30 |
| 2 | Today Daily Change % | -0.97 |
| 3 | Today daily open | 133.73 |
The pair remains strongly bearish on the daily time frame. It trades below the 20 SMA @ 135.32, 50 SMA 132.54, 100 SMA @ 135.43 and 200 SMA @ 137.49.
| Trends | Trends.1 | |
|---|---|---|
| 0 | Daily SMA20 | 135.32 |
| 1 | Daily SMA50 | 132.54 |
| 2 | Daily SMA100 | 135.43 |
| 3 | Daily SMA200 | 137.49 |
The previous day high was 133.82 while the previous day low was 131.72. The daily 38.2% Fib levels comes at 133.02, expected to provide resistance. Similarly, the daily 61.8% fib level is at 132.52, expected to provide resistance.
Note the levels of interest below:
- Pivot support is noted at 132.36, 130.98, 130.25
- Pivot resistance is noted at 134.46, 135.2, 136.57
| Levels | Levels.1 |
|---|---|
| Previous Daily High | 133.82 |
| Previous Daily Low | 131.72 |
| Previous Weekly High | 137.91 |
| Previous Weekly Low | 134.12 |
| Previous Monthly High | 136.92 |
| Previous Monthly Low | 128.08 |
| Daily Fibonacci 38.2% | 133.02 |
| Daily Fibonacci 61.8% | 132.52 |
| Daily Pivot Point S1 | 132.36 |
| Daily Pivot Point S2 | 130.98 |
| Daily Pivot Point S3 | 130.25 |
| Daily Pivot Point R1 | 134.46 |
| Daily Pivot Point R2 | 135.20 |
| Daily Pivot Point R3 | 136.57 |
[/s2If]
Join Our Telegram Group
")


