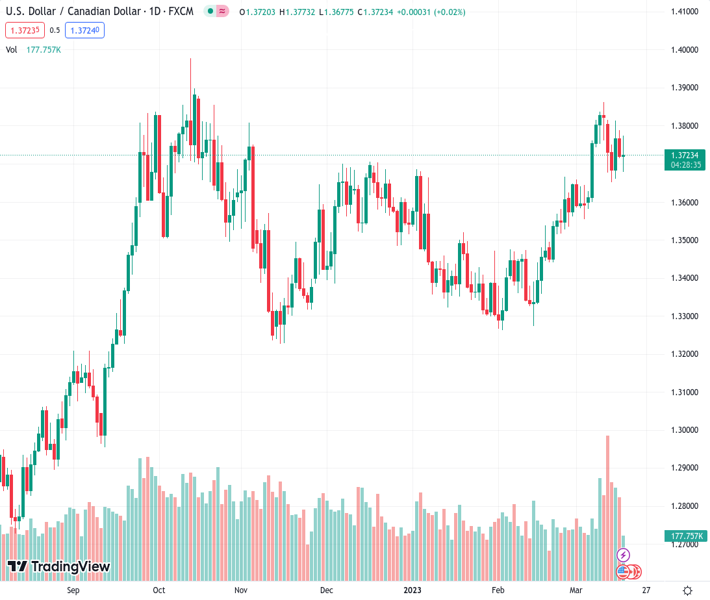
#USDCAD @ 1.37331 still down for the week and pointing to the upside. (Pivot Orderbook analysis)
…
This is a premium post.
[s2If !current_user_can(access_s2member_level4)]Please register for PREMIUM VERSION HERE to read full post below containing analysis. In case of any error or you think you are not able to read the full post below, please email us at support#nehcap.com [lwa][/s2If] [s2If current_user_can(access_s2member_level4)]
- USD/CAD still down for the week and pointing to the upside.
- US Dollar mixed on Friday between lower US yields and risk aversion.
- Key events for next week: Canada CPI (Tuesday) and FOMC meeting (Wednesday).
The pair currently trades last at 1.37331.
The previous day high was 1.3788 while the previous day low was 1.3714. The daily 38.2% Fib levels comes at 1.3742, expected to provide resistance. Similarly, the daily 61.8% fib level is at 1.376, expected to provide resistance.
The USD/CAD printed a fresh daily high on Friday at 1.3772, amid a weaker Loonie and a mixed Greenback. After moving away from the bottom, the pair is about to post a small weekly loss.
Data released on Friday showed the Canadian Industrial Product Price Index dropped 0.8%, a surprise considering market expectations of a 1.6% increase. The Raw Material Price Index fell 0.4%, below the estimate 0%. The economic figures did not help the Loonie, that is among the worst performers on Friday.
Next week, the key report from the Canadian economy will be February’s Consumer Price Index (CPI) on Tuesday. It is expected to show an increase of 0.4% MoM, and the annual rate slowing from 5.9% in January to 5.5%.
The US Dollar is mixed on Friday, attempting a recovery as stocks in Wall Street deepen losses. US yields are down by 4% on average, with the 10-year at 3.41%, slightly above March lows.
Markets remain anxious with the banking turmoil and next week is the FOMC meeting. The consensus is still for a 25bps rate hike but the end of the tightening cycle is seen sooner than previously thought. The change in expectations weighed on the Greenback.
The USD/CAD has been making higher lows and lower highs during the last sessions. On Friday, it reversed from a two-day low at 1.3676 and jumped to 1.3763. The short-term direction is not clear.
The pair remains above the 20-day Simple Moving Average (1.3655) and also above the 1.3660/70 key support area. While above that two supports, the outlook looks constructive for the USD/CAD.
Technical Levels: Supports and Resistances
USDCAD currently trading at 1.3753 at the time of writing. Pair opened at 1.3722 and is trading with a change of 0.23 % .
| Overview | Overview.1 | |
|---|---|---|
| 0 | Today last price | 1.3753 |
| 1 | Today Daily Change | 0.0031 |
| 2 | Today Daily Change % | 0.2300 |
| 3 | Today daily open | 1.3722 |
The pair remains strongly bullish on the daily timeframe. It trades above its 20 SMA @ 1.3645, 50 SMA 1.3492, 100 SMA @ 1.3508 and 200 SMA @ 1.3335.
| Trends | Trends.1 | |
|---|---|---|
| 0 | Daily SMA20 | 1.3645 |
| 1 | Daily SMA50 | 1.3492 |
| 2 | Daily SMA100 | 1.3508 |
| 3 | Daily SMA200 | 1.3335 |
The previous day high was 1.3788 while the previous day low was 1.3714. The daily 38.2% Fib levels comes at 1.3742, expected to provide resistance. Similarly, the daily 61.8% fib level is at 1.376, expected to provide resistance.
Note the levels of interest below:
- Pivot support is noted at 1.3694, 1.3667, 1.362
- Pivot resistance is noted at 1.3769, 1.3815, 1.3843
| Levels | Levels.1 |
|---|---|
| Previous Daily High | 1.3788 |
| Previous Daily Low | 1.3714 |
| Previous Weekly High | 1.3862 |
| Previous Weekly Low | 1.3582 |
| Previous Monthly High | 1.3666 |
| Previous Monthly Low | 1.3262 |
| Daily Fibonacci 38.2% | 1.3742 |
| Daily Fibonacci 61.8% | 1.3760 |
| Daily Pivot Point S1 | 1.3694 |
| Daily Pivot Point S2 | 1.3667 |
| Daily Pivot Point S3 | 1.3620 |
| Daily Pivot Point R1 | 1.3769 |
| Daily Pivot Point R2 | 1.3815 |
| Daily Pivot Point R3 | 1.3843 |
[/s2If]
Join Our Telegram Group
")


