#USDCAD @ 1.37278 holds lower grounds after declining below 50-HMA, 100-HMA., @nehcap view: Further downside expected (Pivot Orderbook analysis)
…
This is a premium post.
[s2If !current_user_can(access_s2member_level4)]Please register for PREMIUM VERSION HERE to read full post below containing analysis. In case of any error or you think you are not able to read the full post below, please email us at support#nehcap.com [lwa][/s2If] [s2If current_user_can(access_s2member_level4)]
- USD/CAD holds lower grounds after declining below 50-HMA, 100-HMA.
- Downbeat oscillators direct sellers towards a two-week-old ascending support line.
- Bulls may aim for weekly resistance line on crossing 1.3740 hurdle.
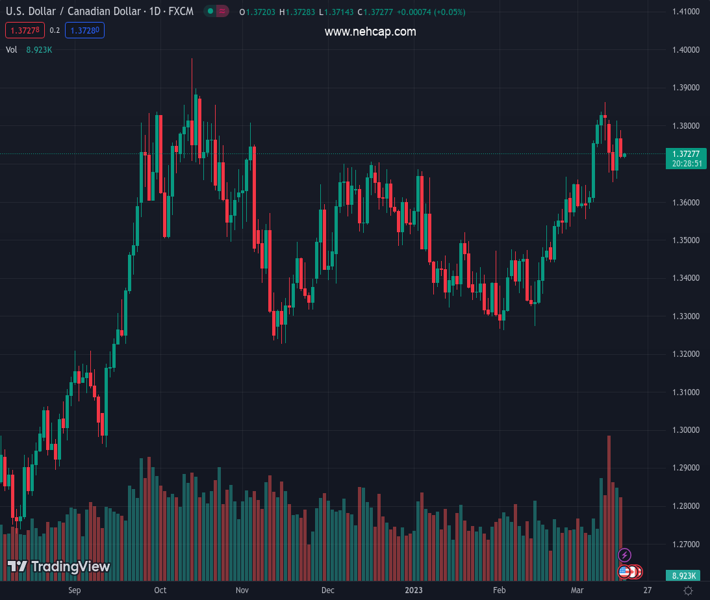
The pair currently trades last at 1.37278.
The previous day high was 1.3788 while the previous day low was 1.3714. The daily 38.2% Fib levels comes at 1.3742, expected to provide resistance. Similarly, the daily 61.8% fib level is at 1.376, expected to provide resistance.
USD/CAD struggles for clear directions around 1.3720-25 after welcoming the bears the previous day. In doing so, the Loonie pair stays defensive while keeping Thursday’s downside break of the 100 and 50 Hourly Moving Averages (HMAs).
Not only the HMA breakdown but the bearish MACD signals and descending RSI (14), not oversold, also keeps the Loonie sellers hopeful of witnessing the further south-run.
That said, the 1.3700 threshold appears to be the immediate support for the USD/CAD sellers to watch ahead of a two-week-old ascending trend line, near 1.3690-85 at the latest.
In a case where the Loonie pair breaks 1.3685, the weekly low surrounding 1.3650 will gain the market’s attention before highlighting the monthly bottom of around 1.3555.
On the flip side, the 100-HMA and the 50-HMA restrict immediate USD/CAD recovery near 1.3730 and 1.3740 in that order.
However, a descending trend line stretched from the last Friday, near 1.3795, as well as the 1.3800 threshold, could restrict the pair’s upside past 1.3740.
Should the quote rally past 1.3740, the odds of witnessing a fresh Year-To-Date (YTD) high, currently around 1.3860, can’t be ruled out.
Overall, USD/CAD remains sidelined between the fortnight-old and weekly trend lines. However, the latest downside break of the HMAs and downbeat oscillators favor the intraday sellers.
Trend: Further downside expected
Technical Levels: Supports and Resistances
USDCAD currently trading at 1.3723 at the time of writing. Pair opened at 1.3722 and is trading with a change of 0.01% % .
| Overview | Overview.1 | |
|---|---|---|
| 0 | Today last price | 1.3723 |
| 1 | Today Daily Change | 0.0001 |
| 2 | Today Daily Change % | 0.01% |
| 3 | Today daily open | 1.3722 |
The pair remains strongly bullish on the daily timeframe. It trades above its 20 SMA @ 1.3645, 50 SMA 1.3492, 100 SMA @ 1.3508 and 200 SMA @ 1.3335.
| Trends | Trends.1 | |
|---|---|---|
| 0 | Daily SMA20 | 1.3645 |
| 1 | Daily SMA50 | 1.3492 |
| 2 | Daily SMA100 | 1.3508 |
| 3 | Daily SMA200 | 1.3335 |
The previous day high was 1.3788 while the previous day low was 1.3714. The daily 38.2% Fib levels comes at 1.3742, expected to provide resistance. Similarly, the daily 61.8% fib level is at 1.376, expected to provide resistance.
Note the levels of interest below:
- Pivot support is noted at 1.3694, 1.3667, 1.362
- Pivot resistance is noted at 1.3769, 1.3815, 1.3843
| Levels | Levels.1 |
|---|---|
| Previous Daily High | 1.3788 |
| Previous Daily Low | 1.3714 |
| Previous Weekly High | 1.3862 |
| Previous Weekly Low | 1.3582 |
| Previous Monthly High | 1.3666 |
| Previous Monthly Low | 1.3262 |
| Daily Fibonacci 38.2% | 1.3742 |
| Daily Fibonacci 61.8% | 1.3760 |
| Daily Pivot Point S1 | 1.3694 |
| Daily Pivot Point S2 | 1.3667 |
| Daily Pivot Point S3 | 1.3620 |
| Daily Pivot Point R1 | 1.3769 |
| Daily Pivot Point R2 | 1.3815 |
| Daily Pivot Point R3 | 1.3843 |
[/s2If]
Join Our Telegram Group
")


