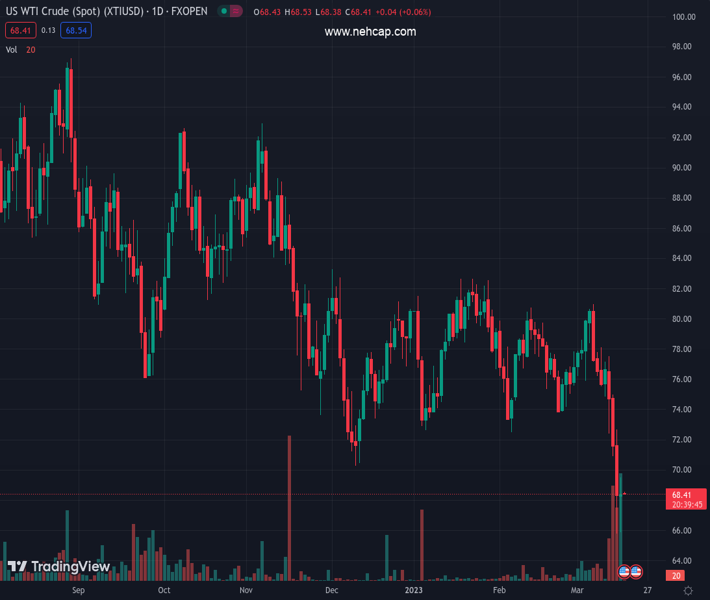
The oil price has shown a stellar recovery after printing a fresh 15-month low at $65.88 and is aiming to stretch it further. (Pivot Orderbook analysis)
…
This is a premium post.
[s2If !current_user_can(access_s2member_level4)]Please register for PREMIUM VERSION HERE to read full post below containing analysis. In case of any error or you think you are not able to read the full post below, please email us at support#nehcap.com [lwa][/s2If] [s2If current_user_can(access_s2member_level4)]
- The oil price has shown a stellar recovery after printing a fresh 15-month low at $65.88 and is aiming to stretch it further.
- US Biden’s denial of further sanctions on Russian oil and revised China’s GDP forecast have supported oil price.
- A bullish reversal has been pinned as the oil price has crossed the critical resistance of $69.00.
The pair currently trades last at 68.52.
The previous day high was 72.69 while the previous day low was 65.81. The daily 38.2% Fib levels comes at 68.44, expected to provide support. Similarly, the daily 61.8% fib level is at 70.06, expected to provide resistance.
West Texas Intermediate (WTI), futures on NYMEX, is making efforts in sustaining its auction above the critical resistance of 68.50 in the early Asian session. The oil price has shown a stellar recovery after printing a fresh 15-month low at $65.88 and is aiming to stretch it further on expectations of a smaller interest rate hike by the Federal Reserve (Fed).
Despite soaring fears of banking turmoil, the oil price has shown a recovery due to the least appetite of the United States for levying more sanctions on oil supply from Russia. US President Joe Biden believes that Russia won’t deliver oil below the current $60/barrel, which could disturb the demand-supply equilibrium.
Also, a surprise upside in China’s Gross Domestic Product (GDP) forecasts has fueled a sense of optimism in the oil price. Goldman Sachs revised 2023 China’s GDP projections higher to 6% from 5.5% anticipated earlier.
WTI has shown a confident recovery after testing a fresh 15-month low at $65.88 on Thursday. The oil price has formed a Double Bottom chart pattern on an hourly scale, which indicates a bullish reversal as the asset re-tested its prior crucial lows with less selling pressure. A bullish reversal has been pinned as the oil price has crossed the critical resistance of $69.00.
The black gold is aiming to shift its auction above the 20-period Exponential Moving Average (EMA) at $68.50, which will underpin a short-term upside trend.
Meanwhile, the Relative Strength Index (RSI) (14) has delivered a range shift move from the bearish territory of 20.00-40.00 to the neutral region of 40.00-60.00, which cements a bullish reversal.
For further upside, the oil price needs to break Thursday’s high at $69.53, which will drive the asset toward the horizontal resistance plotted around $71.00. A break above the latter will further push the oil price to near February 22 low at $73.85.
On the contrary, a downside move below the 15-month low at $65.88 would drag the asset toward 30 November 2021 low at $64.40 followed by 02 December 2021 low at 62.41.
Technical Levels: Supports and Resistances
XTIUSD currently trading at 68.52 at the time of writing. Pair opened at 68.41 and is trading with a change of 0.16 % .
| Overview | Overview.1 | |
|---|---|---|
| 0 | Today last price | 68.52 |
| 1 | Today Daily Change | 0.11 |
| 2 | Today Daily Change % | 0.16 |
| 3 | Today daily open | 68.41 |
The pair remains strongly bearish on the daily time frame. It trades below the 20 SMA @ 76.24, 50 SMA 77.5, 100 SMA @ 79.0 and 200 SMA @ 86.09.
| Trends | Trends.1 | |
|---|---|---|
| 0 | Daily SMA20 | 76.24 |
| 1 | Daily SMA50 | 77.50 |
| 2 | Daily SMA100 | 79.00 |
| 3 | Daily SMA200 | 86.09 |
The previous day high was 72.69 while the previous day low was 65.81. The daily 38.2% Fib levels comes at 68.44, expected to provide support. Similarly, the daily 61.8% fib level is at 70.06, expected to provide resistance.
Note the levels of interest below:
- Pivot support is noted at 65.25, 62.09, 58.37
- Pivot resistance is noted at 72.13, 75.85, 79.01
| Levels | Levels.1 |
|---|---|
| Previous Daily High | 72.69 |
| Previous Daily Low | 65.81 |
| Previous Weekly High | 80.99 |
| Previous Weekly Low | 74.89 |
| Previous Monthly High | 80.75 |
| Previous Monthly Low | 72.50 |
| Daily Fibonacci 38.2% | 68.44 |
| Daily Fibonacci 61.8% | 70.06 |
| Daily Pivot Point S1 | 65.25 |
| Daily Pivot Point S2 | 62.09 |
| Daily Pivot Point S3 | 58.37 |
| Daily Pivot Point R1 | 72.13 |
| Daily Pivot Point R2 | 75.85 |
| Daily Pivot Point R3 | 79.01 |
[/s2If]
Join Our Telegram Group
")


