Financial turmoil weighs on investors’ mood and drags black gold lower. (Pivot Orderbook analysis)
…
This is a premium post.
[s2If !current_user_can(access_s2member_level4)]Please register for PREMIUM VERSION HERE to read full post below containing analysis. In case of any error or you think you are not able to read the full post below, please email us at support#nehcap.com [lwa][/s2If] [s2If current_user_can(access_s2member_level4)]
- Financial turmoil weighs on investors’ mood and drags black gold lower.
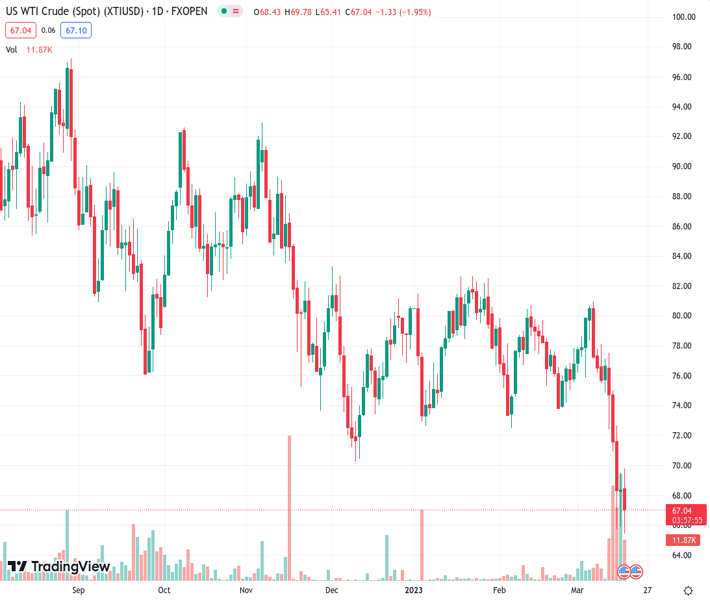
- WTI bounced modestly after posting a fresh 2023 low of $65.22 a barrel.
The pair currently trades last at 66.97.
The previous day high was 69.53 while the previous day low was 65.9. The daily 38.2% Fib levels comes at 68.14, expected to provide resistance. Similarly, the daily 61.8% fib level is at 67.28, expected to provide resistance.
The barrel of West Texas Intermediate fell to $65.22 on Friday, its lowest since November 2022. It currently trades at around $67.30 a barrel, breaking lower amid financial turmoil weighing on the market mood.
The banking crisis triggered by Silicon Valley Bank (SVB) and Signature Bank last week escalated, with Credit Suisse under siege after its top shareholder ruled out providing financial assistance to the company. Stock markets collapsed despite authorities’ efforts to ensure the banking sector was strong enough to bare with the situation.
Nevertheless, concerns remained after SVB officially announced its bankruptcy on Friday, while yet another bank came under scrutiny, First Republic. European and US indexes trade in the red and are poised to finish the week in negative territory.
WTI, in the meantime, is down for a fifth consecutive day, with daily technical readings hinting at continued declines ahead. Once below the aforementioned low, the slump could extend to $62.41, December 2021 monthly low. A break below the latter will likely attract speculative buying, with $60.00 acting as a major psychological barrier. The black gold is currently finding sellers at around $70.00, with gains above the level unlikely to prosper.
Technical Levels: Supports and Resistances
XTIUSD currently trading at 66.97 at the time of writing. Pair opened at 68.43 and is trading with a change of -2.13 % .
| Overview | Overview.1 | |
|---|---|---|
| 0 | Today last price | 66.97 |
| 1 | Today Daily Change | -1.46 |
| 2 | Today Daily Change % | -2.13 |
| 3 | Today daily open | 68.43 |
The pair remains strongly bearish on the daily time frame. It trades below the 20 SMA @ 75.74, 50 SMA 77.39, 100 SMA @ 78.81 and 200 SMA @ 85.84.
| Trends | Trends.1 | |
|---|---|---|
| 0 | Daily SMA20 | 75.74 |
| 1 | Daily SMA50 | 77.39 |
| 2 | Daily SMA100 | 78.81 |
| 3 | Daily SMA200 | 85.84 |
The previous day high was 69.53 while the previous day low was 65.9. The daily 38.2% Fib levels comes at 68.14, expected to provide resistance. Similarly, the daily 61.8% fib level is at 67.28, expected to provide resistance.
Note the levels of interest below:
- Pivot support is noted at 66.38, 64.32, 62.74
- Pivot resistance is noted at 70.01, 71.58, 73.64
| Levels | Levels.1 |
|---|---|
| Previous Daily High | 69.53 |
| Previous Daily Low | 65.90 |
| Previous Weekly High | 80.99 |
| Previous Weekly Low | 74.89 |
| Previous Monthly High | 80.75 |
| Previous Monthly Low | 72.50 |
| Daily Fibonacci 38.2% | 68.14 |
| Daily Fibonacci 61.8% | 67.28 |
| Daily Pivot Point S1 | 66.38 |
| Daily Pivot Point S2 | 64.32 |
| Daily Pivot Point S3 | 62.74 |
| Daily Pivot Point R1 | 70.01 |
| Daily Pivot Point R2 | 71.58 |
| Daily Pivot Point R3 | 73.64 |
[/s2If]
Join Our Telegram Group
")


