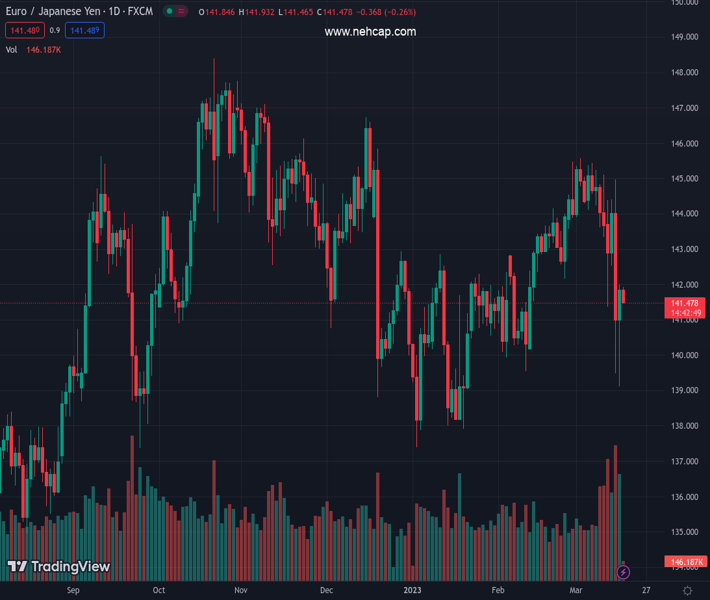
#EURJPY @ 141.552 is facing barricades in extending its recovery above 142.00. (Pivot Orderbook analysis)
…
This is a premium post.
[s2If !current_user_can(access_s2member_level4)]Please register for PREMIUM VERSION HERE to read full post below containing analysis. In case of any error or you think you are not able to read the full post below, please email us at support#nehcap.com [lwa][/s2If] [s2If current_user_can(access_s2member_level4)]
- EUR/JPY is facing barricades in extending its recovery above 142.00.
- The 20-period EMA at 141.50 is providing a cushion to the Euro bulls.
- An oscillation in the 40.00-60.00 range by the RSI (14) indicates a consolidation for now.
The pair currently trades last at 141.552.
The previous day high was 142.01 while the previous day low was 139.13. The daily 38.2% Fib levels comes at 140.91, expected to provide support. Similarly, the daily 61.8% fib level is at 140.23, expected to provide support.
The EUR/JPY pair is continuously struggling to cross the immediate resistance of 142.00. A loss in the upside momentum is favoring a correction as investors are pouring funds into the Japanese Yen amid soaring fears of global banking turmoil.
Bloomberg reported that “Hedge funds held the biggest yen-bearish positions in six months last week, a painful trade as the collapse of Silicon Valley Bank suddenly boosted demand for Japan’s currency as a haven.
The Euro is struggling to gain traction despite a third consecutive 50 basis points (bps) interest rate hike by the European Central Bank (ECB). ECB President Christine Lagarde pushed interest rates to 3.5% despite the debacle of Credit Suisse. The interest rate decision of 50 bps was supported by a promise of a 50bln Swiss Francs infusion into Credit Suisse.
An absence of follow-up buying in the EUR/JPY pair is conveying exhaustion in the upside momentum. The cross is demonstrating an inventory adjustment phase on an hourly scale. It would to early naming it as an accumulation or a distribution amid a volatility contraction.
The 20-period Exponential Moving Average (EMA) at 141.50 is providing a cushion to the Euro bulls.
An oscillation in the 40.00-60.00 range by the Relative Strength Index (RSI) (14) indicates a consolidation for now.
For an upside move, the cross needs to deliver a breakout of the consolidation formed in a 141.50-142.00 range, which will send the major toward March 12 low around 143.00 followed by February 28 low at 143.88.
On the flip side, a downside break below the intraday low at 141.50 would drag the cross toward March 13 low at 139.48. A slippage below the same would expose the asset to January 19 low around 138.00
Technical Levels: Supports and Resistances
EURJPY currently trading at 141.68 at the time of writing. Pair opened at 141.81 and is trading with a change of -0.09 % .
| Overview | Overview.1 | |
|---|---|---|
| 0 | Today last price | 141.68 |
| 1 | Today Daily Change | -0.13 |
| 2 | Today Daily Change % | -0.09 |
| 3 | Today daily open | 141.81 |
The pair remains strongly bearish on the daily time frame. It trades below the 20 SMA @ 143.77, 50 SMA 142.16, 100 SMA @ 142.92 and 200 SMA @ 141.81.
| Trends | Trends.1 | |
|---|---|---|
| 0 | Daily SMA20 | 143.77 |
| 1 | Daily SMA50 | 142.16 |
| 2 | Daily SMA100 | 142.92 |
| 3 | Daily SMA200 | 141.81 |
The previous day high was 142.01 while the previous day low was 139.13. The daily 38.2% Fib levels comes at 140.91, expected to provide support. Similarly, the daily 61.8% fib level is at 140.23, expected to provide support.
Note the levels of interest below:
- Pivot support is noted at 139.96, 138.1, 137.08
- Pivot resistance is noted at 142.84, 143.86, 145.72
| Levels | Levels.1 |
|---|---|
| Previous Daily High | 142.01 |
| Previous Daily Low | 139.13 |
| Previous Weekly High | 145.44 |
| Previous Weekly Low | 143.35 |
| Previous Monthly High | 145.47 |
| Previous Monthly Low | 139.55 |
| Daily Fibonacci 38.2% | 140.91 |
| Daily Fibonacci 61.8% | 140.23 |
| Daily Pivot Point S1 | 139.96 |
| Daily Pivot Point S2 | 138.10 |
| Daily Pivot Point S3 | 137.08 |
| Daily Pivot Point R1 | 142.84 |
| Daily Pivot Point R2 | 143.86 |
| Daily Pivot Point R3 | 145.72 |
[/s2If]
Join Our Telegram Group
")


