#EURJPY @ 140.289 comes under pressure and fades Thursday’s advance. (Pivot Orderbook analysis)
…
This is a premium post.
[s2If !current_user_can(access_s2member_level4)]Please register for PREMIUM VERSION HERE to read full post below containing analysis. In case of any error or you think you are not able to read the full post below, please email us at support#nehcap.com [lwa][/s2If] [s2If current_user_can(access_s2member_level4)]
- EUR/JPY comes under pressure and fades Thursday’s advance.
- Extra weakness remains on the cards below the 200-day SMA.
The pair currently trades last at 140.289.
The previous day high was 142.01 while the previous day low was 139.13. The daily 38.2% Fib levels comes at 140.91, expected to provide resistance. Similarly, the daily 61.8% fib level is at 140.23, expected to provide support.
EUR/JPY resumes the downside and returns to the sub-141.00 region at the end of the week.
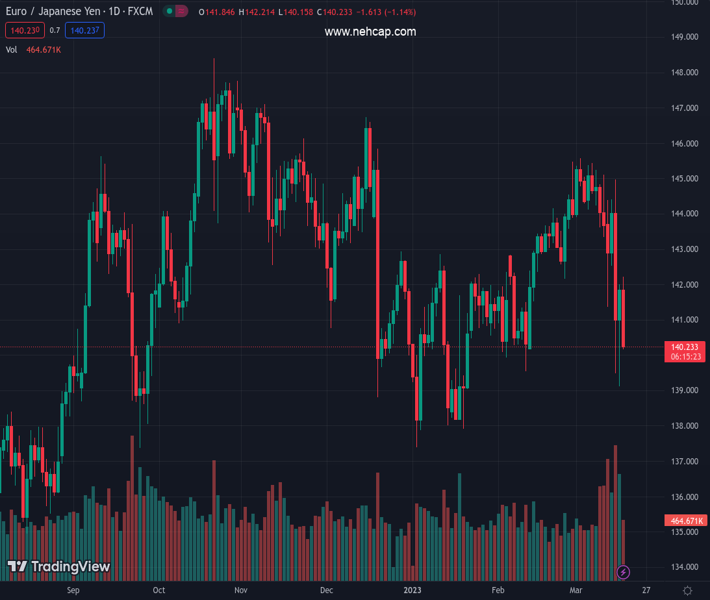
The cross looks side-lined in the second half of the week in the lower end of the weekly range. Occasional bullish attempts should initially clear the provisional 100-day SMA near 142.80 to allow for a test of the 2023 high at 145.56 (March 2).
In the meantime, extra losses remain on the cards while the cross trades below the 200-day SMA. If losses accelerate, then a potential visit to the March low at 139.11 (March 16) should start emerging on the horizon.
EUR/JPY daily chart
Technical Levels: Supports and Resistances
EURJPY currently trading at 141.0 at the time of writing. Pair opened at 141.81 and is trading with a change of -0.57 % .
| Overview | Overview.1 | |
|---|---|---|
| 0 | Today last price | 141.00 |
| 1 | Today Daily Change | 151.00 |
| 2 | Today Daily Change % | -0.57 |
| 3 | Today daily open | 141.81 |
The pair remains strongly bearish on the daily time frame. It trades below the 20 SMA @ 143.77, 50 SMA 142.16, 100 SMA @ 142.92 and 200 SMA @ 141.81.
| Trends | Trends.1 | |
|---|---|---|
| 0 | Daily SMA20 | 143.77 |
| 1 | Daily SMA50 | 142.16 |
| 2 | Daily SMA100 | 142.92 |
| 3 | Daily SMA200 | 141.81 |
The previous day high was 142.01 while the previous day low was 139.13. The daily 38.2% Fib levels comes at 140.91, expected to provide resistance. Similarly, the daily 61.8% fib level is at 140.23, expected to provide support.
Note the levels of interest below:
- Pivot support is noted at 139.96, 138.1, 137.08
- Pivot resistance is noted at 142.84, 143.86, 145.72
| Levels | Levels.1 |
|---|---|
| Previous Daily High | 142.01 |
| Previous Daily Low | 139.13 |
| Previous Weekly High | 145.44 |
| Previous Weekly Low | 143.35 |
| Previous Monthly High | 145.47 |
| Previous Monthly Low | 139.55 |
| Daily Fibonacci 38.2% | 140.91 |
| Daily Fibonacci 61.8% | 140.23 |
| Daily Pivot Point S1 | 139.96 |
| Daily Pivot Point S2 | 138.10 |
| Daily Pivot Point S3 | 137.08 |
| Daily Pivot Point R1 | 142.84 |
| Daily Pivot Point R2 | 143.86 |
| Daily Pivot Point R3 | 145.72 |
[/s2If]
Join Our Telegram Group
")


