#EURGBP @ 0.87580 prints three-day losing streak, justifies downside break of 0.8770-75 confluence., @nehcap view: Further downside expected (Pivot Orderbook analysis)
…
This is a premium post.
[s2If !current_user_can(access_s2member_level4)]Please register for PREMIUM VERSION HERE to read full post below containing analysis. In case of any error or you think you are not able to read the full post below, please email us at support#nehcap.com [lwa][/s2If] [s2If current_user_can(access_s2member_level4)]
- EUR/GBP prints three-day losing streak, justifies downside break of 0.8770-75 confluence.
- Bearish MACD signals add strength to downside bias.
- Recovery moves need validation from 0.8815 to convince bulls.
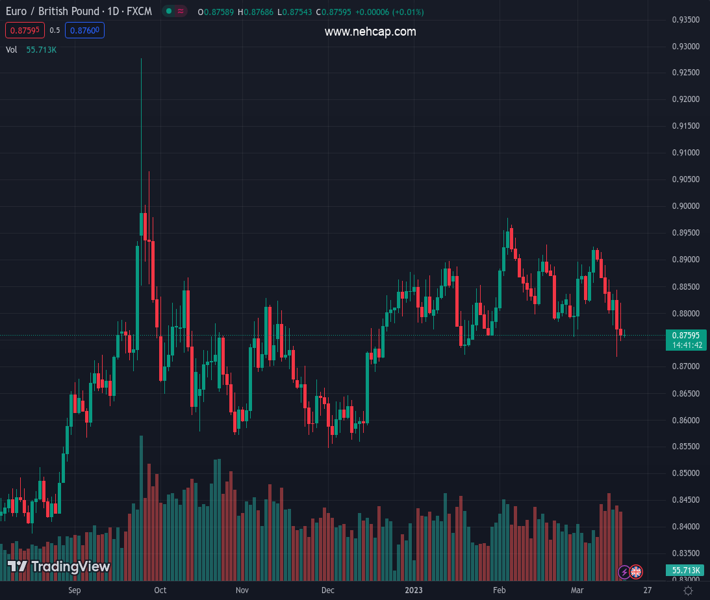
The pair currently trades last at 0.87580.
The previous day high was 0.8819 while the previous day low was 0.8748. The daily 38.2% Fib levels comes at 0.8775, expected to provide resistance. Similarly, the daily 61.8% fib level is at 0.8792, expected to provide resistance.
EUR/GBP justifies the downside break of the previous key support confluence as it portrays a three-day downtrend near 0.8760 heading into Friday’s London open. In doing so, the cross-currency pair remains depressed around the Year-To-Date (YTD) lows marked earlier in the week.
A daily closing below the 0.8775-70 support-turned-resistance confluence, comprising the 100-DMA and an upward-sloping trend line from late December 2022 keeps EUR/GBP bears hopeful. Adding strength to the downside bias are the bearish MACD signals and lower high formation since March 08.
That said, the 61.8% Fibonacci retracement level of the pair’s upside from the last December to February, around 0.8710, seems to lure the EUR/GBP bears of late.
Following that, the December 20, 2022’s low near 0.8690 and the 200-DMA level surrounding 0.8685 could act as the key downside support to challenge the EUR/GBP bears, a break of which could quickly drag prices towards the late 2022 trough of near 0.8550.
Alternatively, recovery moves need to provide successful trading above the 0.8770-75 resistance confluence, previous support, to tease the EUR/GBP buyers.
Even so, a one-week-old descending resistance line, around 0.8815, precedes a three-week-old horizontal resistance, near 0.8835, to challenge the EUR/GBP buyers.
To sum up, EUR/GBP is likely to extend the latest south-run towards refreshing the YTD lows.
Trend: Further downside expected
Technical Levels: Supports and Resistances
EURGBP currently trading at 0.8758 at the time of writing. Pair opened at 0.8763 and is trading with a change of -0.06% % .
| Overview | Overview.1 | |
|---|---|---|
| 0 | Today last price | 0.8758 |
| 1 | Today Daily Change | -0.0005 |
| 2 | Today Daily Change % | -0.06% |
| 3 | Today daily open | 0.8763 |
The pair is trading below its 20 Daily moving average @ 0.8839, below its 50 Daily moving average @ 0.8838 , below its 100 Daily moving average @ 0.877 and above its 200 Daily moving average @ 0.8683
| Trends | Trends.1 | |
|---|---|---|
| 0 | Daily SMA20 | 0.8839 |
| 1 | Daily SMA50 | 0.8838 |
| 2 | Daily SMA100 | 0.8770 |
| 3 | Daily SMA200 | 0.8683 |
The previous day high was 0.8819 while the previous day low was 0.8748. The daily 38.2% Fib levels comes at 0.8775, expected to provide resistance. Similarly, the daily 61.8% fib level is at 0.8792, expected to provide resistance.
Note the levels of interest below:
- Pivot support is noted at 0.8734, 0.8705, 0.8662
- Pivot resistance is noted at 0.8805, 0.8848, 0.8877
| Levels | Levels.1 |
|---|---|
| Previous Daily High | 0.8819 |
| Previous Daily Low | 0.8748 |
| Previous Weekly High | 0.8925 |
| Previous Weekly Low | 0.8821 |
| Previous Monthly High | 0.8979 |
| Previous Monthly Low | 0.8755 |
| Daily Fibonacci 38.2% | 0.8775 |
| Daily Fibonacci 61.8% | 0.8792 |
| Daily Pivot Point S1 | 0.8734 |
| Daily Pivot Point S2 | 0.8705 |
| Daily Pivot Point S3 | 0.8662 |
| Daily Pivot Point R1 | 0.8805 |
| Daily Pivot Point R2 | 0.8848 |
| Daily Pivot Point R3 | 0.8877 |
[/s2If]
Join Our Telegram Group
")


