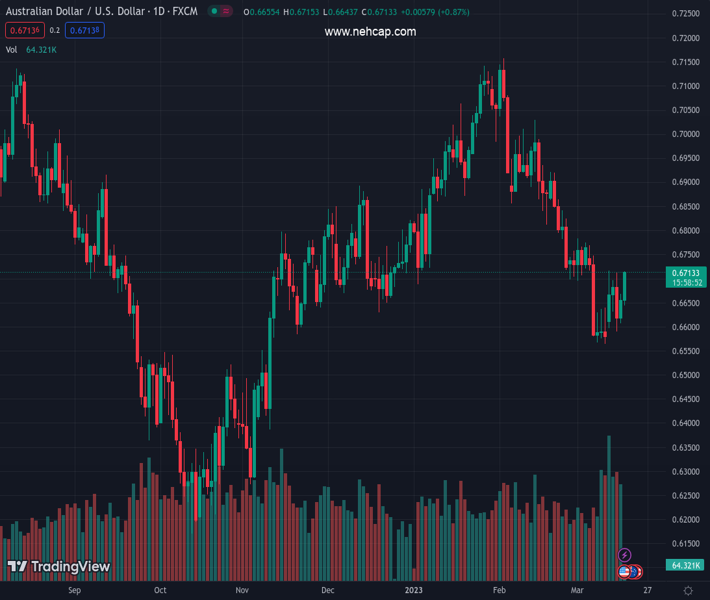
#AUDUSD @ 0.67120 has sensed a stellar buying interest amid the declining USD Index. (Pivot Orderbook analysis)
…
This is a premium post.
[s2If !current_user_can(access_s2member_level4)]Please register for PREMIUM VERSION HERE to read full post below containing analysis. In case of any error or you think you are not able to read the full post below, please email us at support#nehcap.com [lwa][/s2If] [s2If current_user_can(access_s2member_level4)]
- AUD/USD has sensed a stellar buying interest amid the declining USD Index.
- A bull cross, delivered by the 20-and 50-period EMAs at 0.6648 indicates more upside ahead.
- The RS) (14) has shifted into the bullish range, which indicates that the upside momentum has been triggered.
The pair currently trades last at 0.67120.
The previous day high was 0.6668 while the previous day low was 0.661. The daily 38.2% Fib levels comes at 0.6646, expected to provide support. Similarly, the daily 61.8% fib level is at 0.6633, expected to provide support.
The AUD/USD pair has witnessed sheer buying interest from the market participants and has reached near its weekly high plotted near 0.6720. The Aussie asset has attracted significant bids as investors have lightened their longs in the US Dollar Index (DXY) significantly. The reason behind ignoring the USD Index despite fears of global banking turmoil is the accelerating expectations of a less-hawkish stance on interest rates by the Federal Reserve (Fed) ahead.
S&P500 futures have recovered their nominal losses witnessed in Asian morning and has turned positive now. A follow-up buying in the 500-US stocks basket futures after a prominent Thursday indicates a further strengthening of the risk appetite theme. The USD Index has shifted its auction below 104.20 and is expected to deliver more losses, considering that the risk-aversion theme is fading.
After breaking above the critical resistance of 0.6668, AUD/USD has soared above 0.6700. At the press time, the Aussie asset is hovering near the weekly high. A bull cross, delivered by the 20-and 50-period Exponential Moving Averages (EMAs) at 0.6648 indicates more upside ahead.
Adding to that, the Relative Strength Index (RSI) (14) has shifted into the bullish range of 60.00-80.00, which indicates that the upside momentum has been triggered.
Should the asset breaks above March 13 high at 0.6717, Aussie bulls would drive the asset further toward March 07 high at 0.67478 followed by the horizontal resistance plotted from February 23 low at 0.6781.
On the contrary, a slippage below March 15 low at 0.6564 will drag the asset toward October 4 high at 0.6547 and the round-level support at 0.6500.
Technical Levels: Supports and Resistances
AUDUSD currently trading at 0.6708 at the time of writing. Pair opened at 0.6656 and is trading with a change of 0.78 % .
| Overview | Overview.1 | |
|---|---|---|
| 0 | Today last price | 0.6708 |
| 1 | Today Daily Change | 0.0052 |
| 2 | Today Daily Change % | 0.7800 |
| 3 | Today daily open | 0.6656 |
The pair remains strongly bearish on the daily time frame. It trades below the 20 SMA @ 0.6721, 50 SMA 0.6875, 100 SMA @ 0.6775 and 200 SMA @ 0.6767.
| Trends | Trends.1 | |
|---|---|---|
| 0 | Daily SMA20 | 0.6721 |
| 1 | Daily SMA50 | 0.6875 |
| 2 | Daily SMA100 | 0.6775 |
| 3 | Daily SMA200 | 0.6767 |
The previous day high was 0.6668 while the previous day low was 0.661. The daily 38.2% Fib levels comes at 0.6646, expected to provide support. Similarly, the daily 61.8% fib level is at 0.6633, expected to provide support.
Note the levels of interest below:
- Pivot support is noted at 0.6621, 0.6587, 0.6563
- Pivot resistance is noted at 0.6679, 0.6703, 0.6737
| Levels | Levels.1 |
|---|---|
| Previous Daily High | 0.6668 |
| Previous Daily Low | 0.6610 |
| Previous Weekly High | 0.6770 |
| Previous Weekly Low | 0.6564 |
| Previous Monthly High | 0.7158 |
| Previous Monthly Low | 0.6698 |
| Daily Fibonacci 38.2% | 0.6646 |
| Daily Fibonacci 61.8% | 0.6633 |
| Daily Pivot Point S1 | 0.6621 |
| Daily Pivot Point S2 | 0.6587 |
| Daily Pivot Point S3 | 0.6563 |
| Daily Pivot Point R1 | 0.6679 |
| Daily Pivot Point R2 | 0.6703 |
| Daily Pivot Point R3 | 0.6737 |
[/s2If]
Join Our Telegram Group
")


