Asian stocks are following the footprints of the S&P500’s solid recovery recorded on Thursday. (Pivot Orderbook analysis)
…
This is a premium post.
[s2If !current_user_can(access_s2member_level4)]Please register for PREMIUM VERSION HERE to read full post below containing analysis. In case of any error or you think you are not able to read the full post below, please email us at support#nehcap.com [lwa][/s2If] [s2If current_user_can(access_s2member_level4)]
- Asian stocks are following the footprints of the S&P500’s solid recovery recorded on Thursday.
- The collapse of Silicon Valley Bank suddenly boosted demand for the Japanese Yen as a safe-haven.
- An expansionary monetary policy stance is expected by the PBoC as the economy is on the path to economic recovery.
The pair currently trades last at 27271.93.
The previous day high was 27305.64 while the previous day low was 26658.96. The daily 38.2% Fib levels comes at 27058.61, expected to provide support. Similarly, the daily 61.8% fib level is at 26905.99, expected to provide support.
Markets in the Asian domain are following the footprints of the S&P500 as the 500-US stocks basket displayed a solid recovery on Thursday. Stellar recovery in the United States equities was witnessed after investors ignored the potential risk of a global banking meltdown and cheered rising expectations of a smaller interest rate hike by the Federal Reserve (Fed).
The US Dollar Index (DXY) has corrected sharply below 104.10 as the appeal for safe-haven assets has squeezed dramatically. Sheer buying interest for global equities indicates an improvement in the risk appetite of the market participants.
At the press time, Japan’s Nikkei225 jumped 1.14%, ChinaA50 climbed 1.33%, Hang Seng soared 1.72%, and Nifty50 added 0.50%.
Chinese stocks are rising firmly ahead of the interest rate decision by the People’s Bank of China (PBoC), which will be announced on Monday. Considering the requirement of stimulus to trigger overall demand in the Chinese economy after the rollback of pandemic controls, an expansionary monetary policy is expected.
Economist at UOB Group suggests that the PBoC could reduce the Loan Prime Rate (LPR) at its next meeting on March 20. They further added, “With the need for further support measures toward the real economy and for 5Y loan prime rate (LPR) to fall further to boost demand for homes, we see the possibility for the 1Y LPR to fall to 3.55% and 5Y LPR to 4.20% in Mar, following the National People’s Congress (NPC).”
Meanwhile, Japanese equities have got strengthened as ex-Bank of Japan (BoJ) Governor Haruhiko Kuroda has advocated for more rate cuts. Investors should be aware of the fact that BoJ’s current interest rate is already negative and a further rate cut delivers an expression of more stimulus required to trigger more demand. The collapse of the Silicon Valley Bank (SVB) has fueled the demand for the Japanese Yen as safe-haven. Bloomberg reported that “Hedge funds held the biggest yen-bearish positions in six months last week, a painful trade as the collapse of Silicon Valley Bank suddenly boosted demand for Japan’s currency as a haven.
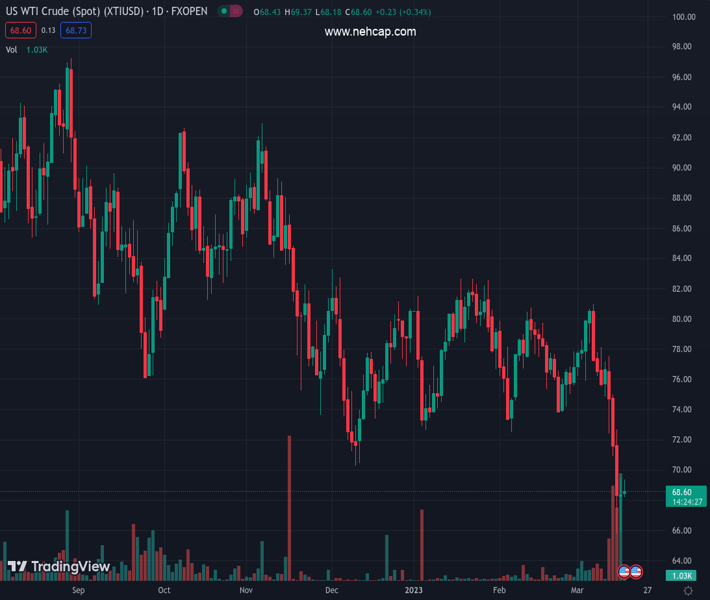
On the oil front, oil price have scaled above $69.00 as an upward revision in 2023 China’s Gross Domestic Product (GDP) to 6.0% by Goldman Sachs, conveys more oil demand ahead. Earlier, the investment banking firm projected a growth rate of 5.5%.
Technical Levels: Supports and Resistances
XTIUSD currently trading at 27271.93 at the time of writing. Pair opened at 27271.93 and is trading with a change of 0.0 % .
| Overview | Overview.1 | |
|---|---|---|
| 0 | Today last price | 27271.93 |
| 1 | Today Daily Change | 0.00 |
| 2 | Today Daily Change % | 0.00 |
| 3 | Today daily open | 27271.93 |
The pair remains strongly bearish on the daily time frame. It trades below the 20 SMA @ 27620.96, 50 SMA 27306.37, 100 SMA @ 27353.1 and 200 SMA @ 27341.98.
| Trends | Trends.1 | |
|---|---|---|
| 0 | Daily SMA20 | 27620.96 |
| 1 | Daily SMA50 | 27306.37 |
| 2 | Daily SMA100 | 27353.10 |
| 3 | Daily SMA200 | 27341.98 |
The previous day high was 27305.64 while the previous day low was 26658.96. The daily 38.2% Fib levels comes at 27058.61, expected to provide support. Similarly, the daily 61.8% fib level is at 26905.99, expected to provide support.
Note the levels of interest below:
- Pivot support is noted at 26852.05, 26432.16, 26205.37
- Pivot resistance is noted at 27498.73, 27725.52, 28145.41
| Levels | Levels.1 |
|---|---|
| Previous Daily High | 27305.64 |
| Previous Daily Low | 26658.96 |
| Previous Weekly High | 28630.69 |
| Previous Weekly Low | 27748.31 |
| Previous Monthly High | 27812.68 |
| Previous Monthly Low | 26985.47 |
| Daily Fibonacci 38.2% | 27058.61 |
| Daily Fibonacci 61.8% | 26905.99 |
| Daily Pivot Point S1 | 26852.05 |
| Daily Pivot Point S2 | 26432.16 |
| Daily Pivot Point S3 | 26205.37 |
| Daily Pivot Point R1 | 27498.73 |
| Daily Pivot Point R2 | 27725.52 |
| Daily Pivot Point R3 | 28145.41 |
[/s2If]
Join Our Telegram Group
")


