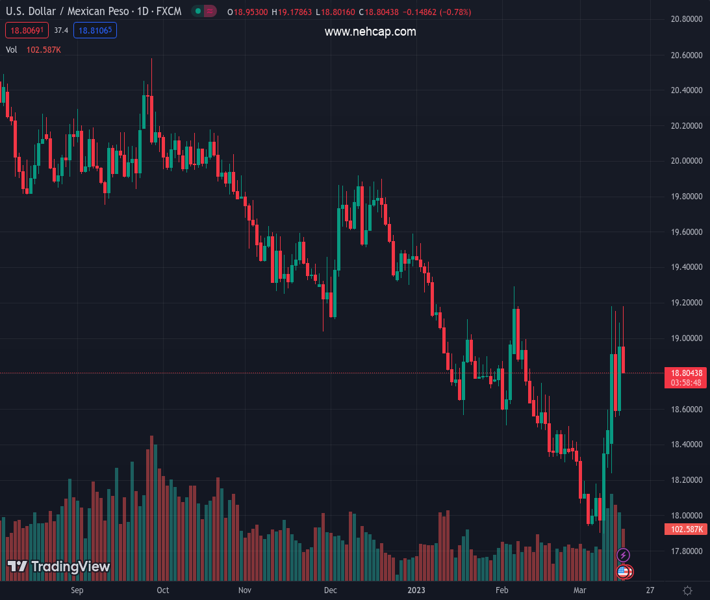
#USDMXN @ 18.8302 dropped from daily highs above $19.00 as market sentiment improved. (Pivot Orderbook analysis)
…
This is a premium post.
[s2If !current_user_can(access_s2member_level4)]Please register for PREMIUM VERSION HERE to read full post below containing analysis. In case of any error or you think you are not able to read the full post below, please email us at support#nehcap.com [lwa][/s2If] [s2If current_user_can(access_s2member_level4)]
- USD/MXN dropped from daily highs above $19.00 as market sentiment improved.
- Data from the United States shows the economy’s resilience despite the ongoing Fed’s aggression.
- Investors are eyeing US Industrial Production, Consumer Sentiment, and next week’s FOMC meeting.
The pair currently trades last at 18.8302.
The previous day high was 19.0902 while the previous day low was 18.584. The daily 38.2% Fib levels comes at 18.8968, expected to provide resistance. Similarly, the daily 61.8% fib level is at 18.7774, expected to provide support.
USD/MXN hovers nearby the $19.00 figure on Thursday, with risk aversion taking center stage, amidst a turbulent week, in the global banking system. Investors’ flight to safety weighed on the Mexican Peso (MXN), which is set to finish the week with losses of 0.15% after testing multi-year lows of 17.8967. However, the MXN holds to gains. At the time of writing, the USD/MXN is trading at around 18.90s, below its opening price by 0.23%.
Traders’ mood improved on headlines that major banks in the United States (US) stepped in to help the First Republic Bank. The European Central Bank (ECB) lifted rates by 50 bps, stating that inflation remained elevated and did not offer any cues about future monetary policy meetings.
Aside from this, the economic data in the United States (US) revealed that the number of people filing for unemployment benefits, as reported by the US Bureau of Labor Statistics (BLS), decreased to less than 200,000. This indicates that the job market is still tight, warranting further action by the Fed. The number of initial jobless claims increased by 192,000, lower than the 205,000 expected by experts. The housing data, including Housing Starts and Building Permits, also surpassed expectations, indicating that the economy is strong despite the Federal Reserve’s aggressive tightening cycle.
Lately, the Mexican Peso recovered ground vs. the US Dollar (USD), which according to the US Dollar Index, is down 0.33%, at 104.397. As sentiment improved, the USD/MXN fell from 19.7986 to the day’s low of 18.8812.
US Treasury bond yields are edging, with the 10-year Treasury bond yielding up six basis points, at 3.522%. For the upcoming meeting, money market futures odds for a 25 bps lift by the Fed moved from 45.4% to 83.4%.
Also read: USD/MXN rallies sharply above $18.80 on SVB crisis, Fed rates repricing
The US economic calendar will feature Industrial Production, Capacity Utilization, and the University of Michigan (UoM) Consumer Sentiment. Traders are eyeing the following week’s Federal Open Market Committee (FOMC) monetary policy decision.
Technical Levels: Supports and Resistances
USDMXN currently trading at 18.9022 at the time of writing. Pair opened at 18.9632 and is trading with a change of -0.32 % .
| Overview | Overview.1 | |
|---|---|---|
| 0 | Today last price | 18.9022 |
| 1 | Today Daily Change | -0.0610 |
| 2 | Today Daily Change % | -0.3200 |
| 3 | Today daily open | 18.9632 |
The pair is trading above its 20 Daily moving average @ 18.3584, above its 50 Daily moving average @ 18.6508 , below its 100 Daily moving average @ 19.0904 and below its 200 Daily moving average @ 19.6348
| Trends | Trends.1 | |
|---|---|---|
| 0 | Daily SMA20 | 18.3584 |
| 1 | Daily SMA50 | 18.6508 |
| 2 | Daily SMA100 | 19.0904 |
| 3 | Daily SMA200 | 19.6348 |
The previous day high was 19.0902 while the previous day low was 18.584. The daily 38.2% Fib levels comes at 18.8968, expected to provide resistance. Similarly, the daily 61.8% fib level is at 18.7774, expected to provide support.
Note the levels of interest below:
- Pivot support is noted at 18.6681, 18.373, 18.162
- Pivot resistance is noted at 19.1742, 19.3852, 19.6803
| Levels | Levels.1 |
|---|---|
| Previous Daily High | 19.0902 |
| Previous Daily Low | 18.5840 |
| Previous Weekly High | 18.5957 |
| Previous Weekly Low | 17.8977 |
| Previous Monthly High | 19.2901 |
| Previous Monthly Low | 18.2954 |
| Daily Fibonacci 38.2% | 18.8968 |
| Daily Fibonacci 61.8% | 18.7774 |
| Daily Pivot Point S1 | 18.6681 |
| Daily Pivot Point S2 | 18.3730 |
| Daily Pivot Point S3 | 18.1620 |
| Daily Pivot Point R1 | 19.1742 |
| Daily Pivot Point R2 | 19.3852 |
| Daily Pivot Point R3 | 19.6803 |
[/s2If]
Join Our Telegram Group
")


