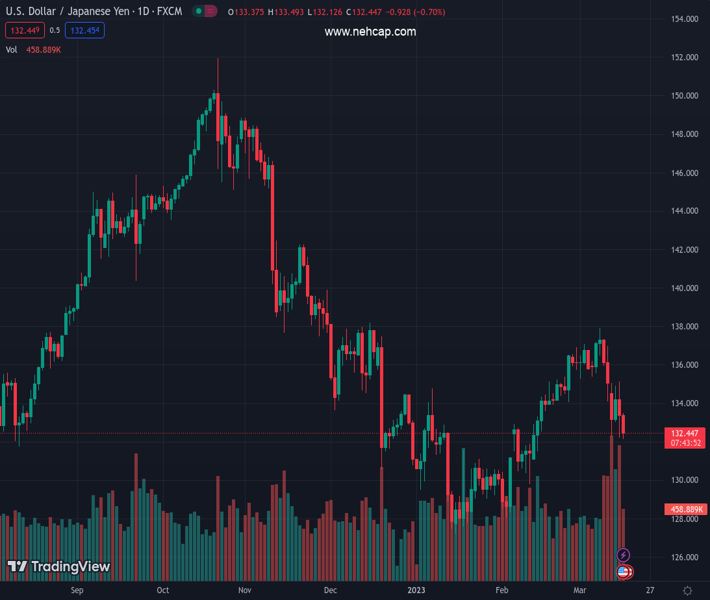
#USDJPY @ 132.576 drifts lower for the second straight day and touches a fresh one-month low on Thursday. (Pivot Orderbook analysis)
…
This is a premium post.
[s2If !current_user_can(access_s2member_level4)]Please register for PREMIUM VERSION HERE to read full post below containing analysis. In case of any error or you think you are not able to read the full post below, please email us at support#nehcap.com [lwa][/s2If] [s2If current_user_can(access_s2member_level4)]
- USD/JPY drifts lower for the second straight day and touches a fresh one-month low on Thursday.
- The prevalent risk-off mood benefits the safe-haven JPY and weighs on the pair amid a weaker USD.
- Break below the 61.8% Fibo. level might have already set the stage for a further depreciating move.
The pair currently trades last at 132.576.
The previous day high was 135.12 while the previous day low was 132.22. The daily 38.2% Fib levels comes at 133.32, expected to provide resistance. Similarly, the daily 61.8% fib level is at 134.01, expected to provide resistance.
The USD/JPY pair drifts lower for the second straight day on Thursday – also marking the fifth day of a negative move in the previous six – and remains depressed through the early North American session. The pair drops a fresh one-month low, around the 132.15 region in the last hour and is pressured by a combination of factors.
Despite the fact that Credit Suisse announced that it will exercise an option to borrow up to $54 billion from the Swiss National Bank (SNB) to restore investors’ confidence, fears of a systemic crisis continue to weigh on the risk sentiment. This is evident from a fresh leg down in the US equity futures, which is seen benefitting the safe-haven Japanese Yen and exerting pressure on the USD/JPY pair.
The global flight to safety leads to a further decline in the US Treasury bond yields, which keeps the US Dollar bulls on the defensive and contributes to the offered tone surrounding the USD/JPY pair. Meanwhile, the disappointing release of the Philly Fed Manufacturing Index offsets the better-than-expected US Jobless Claims and housing market data and does little to provide any impetus.
From a technical perspective, the intraday downfall drags the USD/JPY pair back below the 50% Fibonacci retracement level of the recent rally from the January monthly swing low. Moreover, oscillators on the daily chart have just started gaining negative traction. Hence, some follow-through selling below the 132.00 mark will be seen as a fresh trigger for bearish traders and pave the way for deeper losses.
The USD/JPY pair might then accelerate the fall towards the next relevant support marked by the 61.8% Fibo. level, around the 131.25 region. This is closely followed by the 131.00 mark, below which the downward trajectory could get extended further towards the 130.60 intermediate support before spot prices eventually drop to the 130.00 psychological mark.
On the flip side, attempted recovery might now confront stiff resistance near the 133.00 round figure ahead of the daily swing high, around the 133.50 region. Any subsequent move up is more likely to attract fresh sellers and remain capped near the 133.80 zone, or the 38.2% Fibo. level, which should now act as a pivotal point for the USD/JPY pair.
Technical Levels: Supports and Resistances
USDJPY currently trading at 132.32 at the time of writing. Pair opened at 133.42 and is trading with a change of -0.82 % .
| Overview | Overview.1 | |
|---|---|---|
| 0 | Today last price | 132.32 |
| 1 | Today Daily Change | -1.10 |
| 2 | Today Daily Change % | -0.82 |
| 3 | Today daily open | 133.42 |
The pair remains strongly bearish on the daily time frame. It trades below the 20 SMA @ 135.33, 50 SMA 132.54, 100 SMA @ 135.56 and 200 SMA @ 137.49.
| Trends | Trends.1 | |
|---|---|---|
| 0 | Daily SMA20 | 135.33 |
| 1 | Daily SMA50 | 132.54 |
| 2 | Daily SMA100 | 135.56 |
| 3 | Daily SMA200 | 137.49 |
The previous day high was 135.12 while the previous day low was 132.22. The daily 38.2% Fib levels comes at 133.32, expected to provide resistance. Similarly, the daily 61.8% fib level is at 134.01, expected to provide resistance.
Note the levels of interest below:
- Pivot support is noted at 132.05, 130.68, 129.15
- Pivot resistance is noted at 134.95, 136.48, 137.85
| Levels | Levels.1 |
|---|---|
| Previous Daily High | 135.12 |
| Previous Daily Low | 132.22 |
| Previous Weekly High | 137.91 |
| Previous Weekly Low | 134.12 |
| Previous Monthly High | 136.92 |
| Previous Monthly Low | 128.08 |
| Daily Fibonacci 38.2% | 133.32 |
| Daily Fibonacci 61.8% | 134.01 |
| Daily Pivot Point S1 | 132.05 |
| Daily Pivot Point S2 | 130.68 |
| Daily Pivot Point S3 | 129.15 |
| Daily Pivot Point R1 | 134.95 |
| Daily Pivot Point R2 | 136.48 |
| Daily Pivot Point R3 | 137.85 |
[/s2If]
Join Our Telegram Group
")


