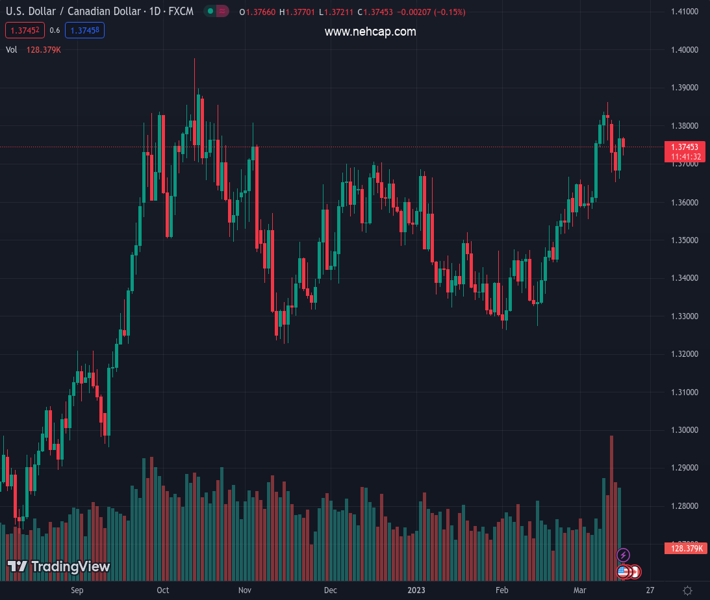
#USDCAD @ 1.37460 meets with a fresh supply on Thursday and is pressured by a combination of factors. (Pivot Orderbook analysis)
…
This is a premium post.
[s2If !current_user_can(access_s2member_level4)]Please register for PREMIUM VERSION HERE to read full post below containing analysis. In case of any error or you think you are not able to read the full post below, please email us at support#nehcap.com [lwa][/s2If] [s2If current_user_can(access_s2member_level4)]
- USD/CAD meets with a fresh supply on Thursday and is pressured by a combination of factors.
- A modest uptick in Oil prices underpins the Loonie and weighs on the pair amid a weaker USD.
- The fundamental backdrop warrants some caution before positioning for any further downfall.
The pair currently trades last at 1.37460.
The previous day high was 1.3814 while the previous day low was 1.366. The daily 38.2% Fib levels comes at 1.3756, expected to provide resistance. Similarly, the daily 61.8% fib level is at 1.3719, expected to provide support.
The USD/CAD pair extends the previous day’s modest pullback from the vicinity of the weekly high, around the 1.3815 region, and remains under some selling pressure on Thursday. The steady intraday descent remains uninterrupted through the first half of the European session and drags spot prices to a fresh daily low, around the 1.3720 region in the last hour.
Crude Oil prices gain some positive traction and reverse a part of the overnight slump to a 15-month low amid the latest positive development surrounding the Credit Suisse saga. This, in turn, is seen underpinning the commodity-linked Loonie and dragging the USD/CAD pair lower amid the emergence of some US Dollar selling. The troubled Swiss bank announced this Thursday that it would borrow up to $54 billion from the Swiss National Bank (SNB) to shore up the liquidity. This led to a modest recovery in the global risk sentiment and weighs on the safe-haven buck.
Investors, however, remain concerned about a broader systemic crisis against the backdrop of last week’s collapse of two mid-size US banks – Silicon Valley Bank and Signature Bank. This, along with fresh turmoil in the European banking sector keeps a lid on the optimism, which is evident from the prevalent cautious mood around the equity markets. Apart from this, reviving bets for at least a 25 bps rate hike by the Federal Reserve at its upcoming meeting on March 21-22 should act as a tailwind for the Greenback and limit losses for the USD/CAD pair, for the time being.
Furthermore, worries that a deeper global economic downturn will dent fuel demand should cap any meaningful upside for the black liquid. This, along with the fact that the Bank of Canada (BoC) became the first major central bank to pause its rate-hiking cycle last week, could undermine the Canadian Dollar. The fundamental backdrop supports prospects for the emergence of some dip-buying around the USD/CAD pair. This, in turn, warrants some caution for aggressive bearish traders, or before positioning for any further intraday depreciating move for the major.
Market participants now look forward to the US economic docket, featuring the usual Weekly Initial Jobless Claims, the Philly Fed Manufacturing Index, Building Permits and Housing Starts later during the early North American session. This, along with the European Central Bank (ECB)-inspired volatility and the broader market risk sentiment will drive the USD demand and provide some impetus to the USD/CAD pair. Traders will further take cues from Oil price dynamics to grab short-term opportunities around the major.
Technical Levels: Supports and Resistances
USDCAD currently trading at 1.3742 at the time of writing. Pair opened at 1.3767 and is trading with a change of -0.18 % .
| Overview | Overview.1 | |
|---|---|---|
| 0 | Today last price | 1.3742 |
| 1 | Today Daily Change | -0.0025 |
| 2 | Today Daily Change % | -0.1800 |
| 3 | Today daily open | 1.3767 |
The pair remains strongly bullish on the daily timeframe. It trades above its 20 SMA @ 1.3632, 50 SMA 1.3489, 100 SMA @ 1.3507 and 200 SMA @ 1.333.
| Trends | Trends.1 | |
|---|---|---|
| 0 | Daily SMA20 | 1.3632 |
| 1 | Daily SMA50 | 1.3489 |
| 2 | Daily SMA100 | 1.3507 |
| 3 | Daily SMA200 | 1.3330 |
The previous day high was 1.3814 while the previous day low was 1.366. The daily 38.2% Fib levels comes at 1.3756, expected to provide resistance. Similarly, the daily 61.8% fib level is at 1.3719, expected to provide support.
Note the levels of interest below:
- Pivot support is noted at 1.368, 1.3593, 1.3526
- Pivot resistance is noted at 1.3835, 1.3902, 1.3989
| Levels | Levels.1 |
|---|---|
| Previous Daily High | 1.3814 |
| Previous Daily Low | 1.3660 |
| Previous Weekly High | 1.3862 |
| Previous Weekly Low | 1.3582 |
| Previous Monthly High | 1.3666 |
| Previous Monthly Low | 1.3262 |
| Daily Fibonacci 38.2% | 1.3756 |
| Daily Fibonacci 61.8% | 1.3719 |
| Daily Pivot Point S1 | 1.3680 |
| Daily Pivot Point S2 | 1.3593 |
| Daily Pivot Point S3 | 1.3526 |
| Daily Pivot Point R1 | 1.3835 |
| Daily Pivot Point R2 | 1.3902 |
| Daily Pivot Point R3 | 1.3989 |
[/s2If]
Join Our Telegram Group
")


