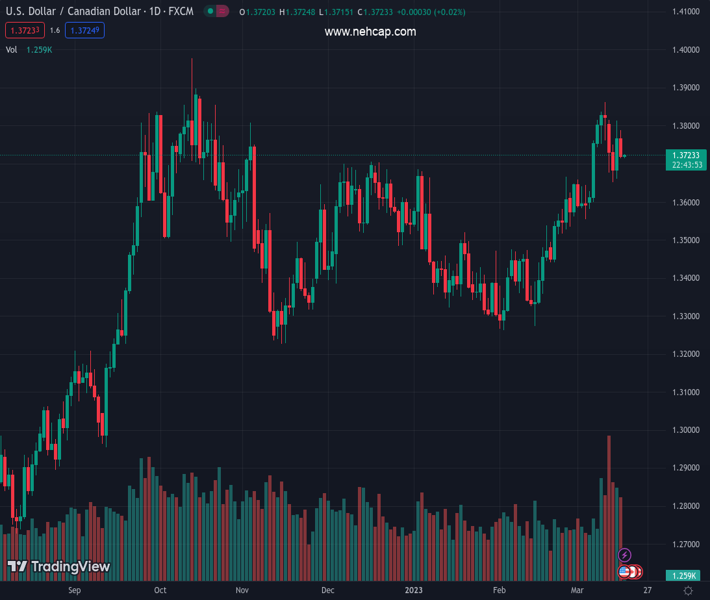
#USDCAD @ 1.37180 is demonstrating a sideways auction, following the footprints of the USD Index. (Pivot Orderbook analysis)
…
This is a premium post.
[s2If !current_user_can(access_s2member_level4)]Please register for PREMIUM VERSION HERE to read full post below containing analysis. In case of any error or you think you are not able to read the full post below, please email us at support#nehcap.com [lwa][/s2If] [s2If current_user_can(access_s2member_level4)]
- USD/CAD is demonstrating a sideways auction, following the footprints of the USD Index.
- After the fiasco of SVB, Signature Bank, and Credit Suisse, a US-based First Republic Bank came under scrutiny.
- The demand for US government bonds dropped as investors are now considering an unchanged monetary policy by the Fed.
The pair currently trades last at 1.37180.
The previous day high was 1.3814 while the previous day low was 1.366. The daily 38.2% Fib levels comes at 1.3756, expected to provide resistance. Similarly, the daily 61.8% fib level is at 1.3719, expected to provide resistance.
The USD/CAD pair is displaying a back-and-forth action around 1.3720 in the early Asian session. The Loonie asset has turned sideways after a downside move and is expected to continue further toward the round-level support of 1.3700. The downside bias for the major has built as investors are worried about global banking turmoil, which is stretching day after day.
After the fiasco of Silicon Valley Bank (SVB), Signature Bank, and Credit Suisse, a US-based First Republic Bank has come under scrutiny. As reported by Reuters, financial institutions including JP Morgan Chase & Co and Morgan Stanley, confirmed earlier reports they would deposit up to $30 billion into First Republic Bank’s coffers to stabilize the lender.
Although the move would infuse fresh life into the foreign exchange bank, it won’t fade the fact that global banking turmoil is for real and central banks are going to face various problems in executing their monetary policies, which are operated through commercial banks.
S&P500 futures recovered early losses and settled Thursday’s session on a promising note. The demand for US government bonds dropped as investors are now considering an unchanged monetary policy by the Federal Reserve (Fed) as the banking crisis is deepening. Also, the declining trend of the United States Consumer Price Index (CPI) is also supportive. Therefore, the 10-year US Treasury yields have gained to 3.58%.
The US Dollar Index (DXY) remained sideways around 104.40 as the street is mixed about unchanged monetary policy or a 25 basis point (bps) interest rate hike by the Fed next week.
On the oil front, oil price has corrected marginally after a recovery move and an upside extension is expected as the G7 countries are restricting themselves from further sanctions on Russia after setting the price cap at $60/barrel. It is worth noting that Canada is a leading exporter of oil to the US and a recovery in the oil price would support the Canadian Dollar.
Technical Levels: Supports and Resistances
USDCAD currently trading at 1.3721 at the time of writing. Pair opened at 1.3767 and is trading with a change of -0.33 % .
| Overview | Overview.1 | |
|---|---|---|
| 0 | Today last price | 1.3721 |
| 1 | Today Daily Change | -0.0046 |
| 2 | Today Daily Change % | -0.3300 |
| 3 | Today daily open | 1.3767 |
The pair remains strongly bullish on the daily timeframe. It trades above its 20 SMA @ 1.3632, 50 SMA 1.3489, 100 SMA @ 1.3507 and 200 SMA @ 1.333.
| Trends | Trends.1 | |
|---|---|---|
| 0 | Daily SMA20 | 1.3632 |
| 1 | Daily SMA50 | 1.3489 |
| 2 | Daily SMA100 | 1.3507 |
| 3 | Daily SMA200 | 1.3330 |
The previous day high was 1.3814 while the previous day low was 1.366. The daily 38.2% Fib levels comes at 1.3756, expected to provide resistance. Similarly, the daily 61.8% fib level is at 1.3719, expected to provide resistance.
Note the levels of interest below:
- Pivot support is noted at 1.368, 1.3593, 1.3526
- Pivot resistance is noted at 1.3835, 1.3902, 1.3989
| Levels | Levels.1 |
|---|---|
| Previous Daily High | 1.3814 |
| Previous Daily Low | 1.3660 |
| Previous Weekly High | 1.3862 |
| Previous Weekly Low | 1.3582 |
| Previous Monthly High | 1.3666 |
| Previous Monthly Low | 1.3262 |
| Daily Fibonacci 38.2% | 1.3756 |
| Daily Fibonacci 61.8% | 1.3719 |
| Daily Pivot Point S1 | 1.3680 |
| Daily Pivot Point S2 | 1.3593 |
| Daily Pivot Point S3 | 1.3526 |
| Daily Pivot Point R1 | 1.3835 |
| Daily Pivot Point R2 | 1.3902 |
| Daily Pivot Point R3 | 1.3989 |
[/s2If]
Join Our Telegram Group
")


