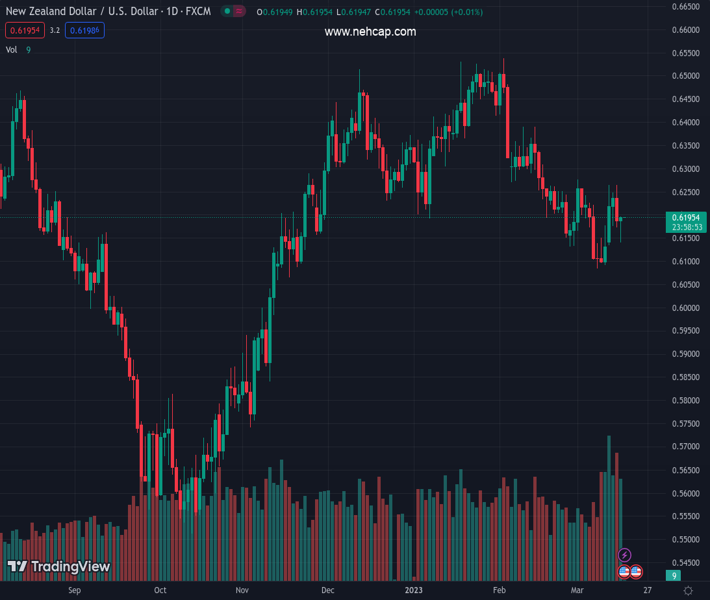
#NZDUSD @ 0.61900 is subdued, around the 0.6190s ahead of Friday’s US economic data. (Pivot Orderbook analysis)
…
This is a premium post.
[s2If !current_user_can(access_s2member_level4)]Please register for PREMIUM VERSION HERE to read full post below containing analysis. In case of any error or you think you are not able to read the full post below, please email us at support#nehcap.com [lwa][/s2If] [s2If current_user_can(access_s2member_level4)]
- NZD/USD is subdued, around the 0.6190s ahead of Friday’s US economic data.
- A risk-on impulse spurred the NZD/USD’s bounce from daily lows despite printing bad NZ GDP data.
- NZD/USD Analysis: Short-term is upwards, though a break above 0.6200 will poise the pair towards the 200-DMA.
The pair currently trades last at 0.61900.
The previous day high was 0.6271 while the previous day low was 0.6172. The daily 38.2% Fib levels comes at 0.621, expected to provide resistance. Similarly, the daily 61.8% fib level is at 0.6233, expected to provide resistance.
NZD/USD is about to finish Thursday’s session flat after diving towards a daily low of 0.6139. The European Central Bank (ECB) lifted rates amidst turbulent times. However, news that Swiss authorities backed Credit Suisse and major US banks stepping in to help First Republic Bank eased investors’ fears. Therefore, the NZD/USD recovered and is trading at 0.6191, a gain of 0.06%.
Wall Street finished with gains between 1.12% and 2.48%. Employment data in the United States (US), delivered by the Bureau of Labor Statistics (BLS), showed that unemployment claims for the last week rose by 192K below estimates of 205K, less than the prior week’s 212K. In the meantime, housing data like Building Permits and Housing Starts came above estimates and the prior’s month data.
At the same time, the Philadelphia Fed revealed that manufacturing activity contracted at a slower rate in March.
In the meantime, the US Dollar Index, a measure of the buck’s value against a basket of six currencies, losses 0.30%, at 104.430, a tailwind for the NZD/USD.
Earlier in the Asian session, the New Zealand Dollar (NZD) weakened on the release of the New Zealand (NZ) Gross Domestic Product (GDP) for Q4, which contracted 0.6% QoQ, and below the Reserve Bank of New Zealand (RBNZ) MPS projection of 0.7% expansion.
Analysts at ANZ Bank said, “the record Q4 current account deficit, amid waning appetite for NZGBs, the Kiwi may face headwinds in coming weeks. A Fed hike and/or higher dot plots next week, alongside reduced financial instability, may also see markets become more positive on the USD.”
The NZ economic docket is empty toward the end of the week. In monthly and annual readings, the US calendar wil feature Indutstiral Production for February. The MoM figures are estimated at 0.2%, above January’s 0%. In addition, the University of Michigan (UoM) Consumer Sentiment poll will update American sentiment regarding the economy and revise inflation expectations.
The NZD/USD 4-hour chart portrays the pair bottomed around the 0.6120 area. On Thursday’s session, the pair’s low was around the S1 daily pivot, used as a springboard, with prices rising towards the confluence of the 20 and 50-Exponential Moving Averages (EMAs) at 0.6183-87. A breach of the 100-EMA at 0.6200 and the NZD/USD might test the 200-EMA in the near term at 0.6239. Otherwise, an NZD/USD fall beneath 0.6139, and the 0.6100 would be up for grabs.
Technical Levels: Supports and Resistances
NZDUSD currently trading at 0.6194 at the time of writing. Pair opened at 0.6188 and is trading with a change of 0.1 % .
| Overview | Overview.1 | |
|---|---|---|
| 0 | Today last price | 0.6194 |
| 1 | Today Daily Change | 0.0006 |
| 2 | Today Daily Change % | 0.1000 |
| 3 | Today daily open | 0.6188 |
The pair is trading below its 20 Daily moving average @ 0.6196, below its 50 Daily moving average @ 0.6315 , below its 100 Daily moving average @ 0.6254 and above its 200 Daily moving average @ 0.6164
| Trends | Trends.1 | |
|---|---|---|
| 0 | Daily SMA20 | 0.6196 |
| 1 | Daily SMA50 | 0.6315 |
| 2 | Daily SMA100 | 0.6254 |
| 3 | Daily SMA200 | 0.6164 |
The previous day high was 0.6271 while the previous day low was 0.6172. The daily 38.2% Fib levels comes at 0.621, expected to provide resistance. Similarly, the daily 61.8% fib level is at 0.6233, expected to provide resistance.
Note the levels of interest below:
- Pivot support is noted at 0.615, 0.6111, 0.6051
- Pivot resistance is noted at 0.6249, 0.631, 0.6348
| Levels | Levels.1 |
|---|---|
| Previous Daily High | 0.6271 |
| Previous Daily Low | 0.6172 |
| Previous Weekly High | 0.6226 |
| Previous Weekly Low | 0.6084 |
| Previous Monthly High | 0.6538 |
| Previous Monthly Low | 0.6131 |
| Daily Fibonacci 38.2% | 0.6210 |
| Daily Fibonacci 61.8% | 0.6233 |
| Daily Pivot Point S1 | 0.6150 |
| Daily Pivot Point S2 | 0.6111 |
| Daily Pivot Point S3 | 0.6051 |
| Daily Pivot Point R1 | 0.6249 |
| Daily Pivot Point R2 | 0.6310 |
| Daily Pivot Point R3 | 0.6348 |
[/s2If]
Join Our Telegram Group
")


