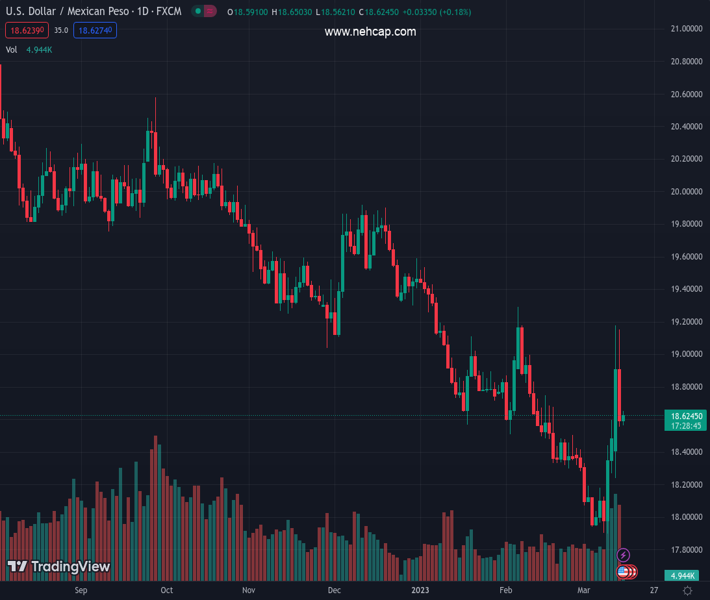
#USDMXN @ 18.6189 remains sidelined near one-week-old ascending support line after falling the most since March 2022., @nehcap view: Further downside expected (Pivot Orderbook analysis)
…
This is a premium post.
[s2If !current_user_can(access_s2member_level4)]Please register for PREMIUM VERSION HERE to read full post below containing analysis. In case of any error or you think you are not able to read the full post below, please email us at support#nehcap.com [lwa][/s2If] [s2If current_user_can(access_s2member_level4)]
- USD/MXN remains sidelined near one-week-old ascending support line after falling the most since March 2022.
- Clear U-turn from 2.5-month-old descending resistance line, bearish MACD signals keep sellers hopeful.
- 200-SMA acts as an extra filter towards the south.
The pair currently trades last at 18.6189.
The previous day high was 19.1545 while the previous day low was 18.5556. The daily 38.2% Fib levels comes at 18.7844, expected to provide resistance. Similarly, the daily 61.8% fib level is at 18.9257, expected to provide resistance.
USD/MXN holds lower ground near 18.61 as bears poke one-week-old ascending support line during early Wednesday. In doing so, the Mexican Peso (MXN) pair justifies the bearish MACD signals, as well as the quote’s U-turn from a downward-sloping resistance line from December 30, 2022.
It’s worth noting that the 200-SMA level surrounding 18.50 acts as additional support, other than the aforementioned trend line of near 18.60.
In a case where USD/MXN remains weak past 18.50, the odds of witnessing a slump towards the weekly low near 18.20 and then to the March 07 peak of 18.17 can’t be ruled out.
Should the MXN pair manage to conquer the 18.17 support, the bears can quickly approach the 18.00 psychological magnet before eyeing the monthly low of 17.90, also the lowest levels since October 2018.
On the contrary, USD/MXN recovery could initially aim for the 50% and 61.8% Fibonacci retracement level of the pair’s declines from late December 2022 to early March 2023, respectively near 18.75 and 18.95 in that order.
However, the pair buyers remain off the table unless successfully cross the multi-day-old resistance line, around the 19.00 round figure.
Overall, USD/MXN is likely to remain bearish even as the downside room appears limited.
Trend: Further downside expected
Technical Levels: Supports and Resistances
USDMXN currently trading at 18.6173 at the time of writing. Pair opened at 18.6004 and is trading with a change of 0.09% % .
| Overview | Overview.1 | |
|---|---|---|
| 0 | Today last price | 18.6173 |
| 1 | Today Daily Change | 0.0169 |
| 2 | Today Daily Change % | 0.09% |
| 3 | Today daily open | 18.6004 |
The pair is trading above its 20 Daily moving average @ 18.3393, below its 50 Daily moving average @ 18.659 , below its 100 Daily moving average @ 19.1002 and below its 200 Daily moving average @ 19.6379
| Trends | Trends.1 | |
|---|---|---|
| 0 | Daily SMA20 | 18.3393 |
| 1 | Daily SMA50 | 18.6590 |
| 2 | Daily SMA100 | 19.1002 |
| 3 | Daily SMA200 | 19.6379 |
The previous day high was 19.1545 while the previous day low was 18.5556. The daily 38.2% Fib levels comes at 18.7844, expected to provide resistance. Similarly, the daily 61.8% fib level is at 18.9257, expected to provide resistance.
Note the levels of interest below:
- Pivot support is noted at 18.3858, 18.1713, 17.787
- Pivot resistance is noted at 18.9847, 19.369, 19.5836
| Levels | Levels.1 |
|---|---|
| Previous Daily High | 19.1545 |
| Previous Daily Low | 18.5556 |
| Previous Weekly High | 18.5957 |
| Previous Weekly Low | 17.8977 |
| Previous Monthly High | 19.2901 |
| Previous Monthly Low | 18.2954 |
| Daily Fibonacci 38.2% | 18.7844 |
| Daily Fibonacci 61.8% | 18.9257 |
| Daily Pivot Point S1 | 18.3858 |
| Daily Pivot Point S2 | 18.1713 |
| Daily Pivot Point S3 | 17.7870 |
| Daily Pivot Point R1 | 18.9847 |
| Daily Pivot Point R2 | 19.3690 |
| Daily Pivot Point R3 | 19.5836 |
[/s2If]
Join Our Telegram Group
")


