#USDJPY @ 133.718 ticks down, last at 133.88 ahead of US Retail Sales data (Pivot Orderbook analysis)
…
This is a premium post.
[s2If !current_user_can(access_s2member_level4)]Please register for PREMIUM VERSION HERE to read full post below containing analysis. In case of any error or you think you are not able to read the full post below, please email us at support#nehcap.com [lwa][/s2If] [s2If current_user_can(access_s2member_level4)]
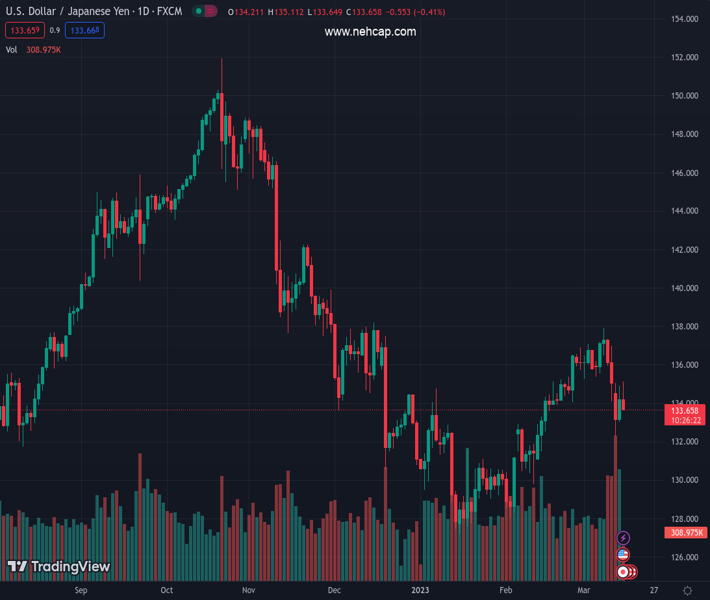
The pair currently trades last at 133.718.
The previous day high was 134.9 while the previous day low was 133.03. The daily 38.2% Fib levels comes at 134.19, expected to provide resistance. Similarly, the daily 61.8% fib level is at 133.74, expected to provide resistance.
USD/JPY prints a slightly negative intraday movement on Wednesday, with the last recorded price at 133.88. The currency pair started the session at 134.22, the previous close, and fluctuated between the lowest intraday price of 133.82 and the highest intraday price of 135.10. The overall intraday price change stands at -0.03% at press time.
The US 10-year Treasury bond yield hovers around 3.67%, diminishing the prior day’s rebound, while the two-year bond yield climbs to 4.32% at press time. Notably, the US 10-year Treasury bond yield recorded its most significant daily increase in five weeks on Tuesday, while the two-year counterpart rebounded from a six-month low.
The Bank of Japan’s (BoJ) mildly dovish Monetary Policy Meeting Minutes support the USD/JPY’s upward movement. According to the BoJ Minutes statement, “It is important to continue with monetary easing.”
Furthermore, the BoJ Minutes revealed that members concurred that Japan’s inflation would decelerate during the latter part of the upcoming fiscal year.
USD/JPY traders should closely monitor the below data:
Meanwhile, bond yields and ‘shunto’ negotiations may provide further guidance for traders of the Yen pair.
The USD/JPY pair trades just above its daily 50-SMA (133.87), signaling a bullish trend in short to medium term. The currency pair surpassed the 38.2% Fibonacci level at 134.19 but did not reach the 61.8% Fibonacci level at 133.74, suggesting some support near the latter level.
The daily RSI(14) of 48.128 indicates a neutral momentum as the pair hovers around the 50 mark. However, the market may encounter some resistance, as the daily resistance levels are 135.08, 135.93, and 136.95.
The daily pivot point for the USD/JPY pair is 134.05. The daily support levels are found at 133.20, 132.18, and 131.33. If the pair manages to break above the pivot point, it may test the resistance levels, while a break below the pivot point could trigger a test of the support levels.
Technical Levels: Supports and Resistances
USDJPY currently trading at 134.2 at the time of writing. Pair opened at 134.23 and is trading with a change of -0.02 % .
| Overview | Overview.1 | |
|---|---|---|
| 0 | Today last price | 134.20 |
| 1 | Today Daily Change | -0.03 |
| 2 | Today Daily Change % | -0.02 |
| 3 | Today daily open | 134.23 |
The pair is trading below its 20 Daily moving average @ 135.36, above its 50 Daily moving average @ 132.52 , below its 100 Daily moving average @ 135.69 and below its 200 Daily moving average @ 137.5
| Trends | Trends.1 | |
|---|---|---|
| 0 | Daily SMA20 | 135.36 |
| 1 | Daily SMA50 | 132.52 |
| 2 | Daily SMA100 | 135.69 |
| 3 | Daily SMA200 | 137.50 |
The previous day high was 134.9 while the previous day low was 133.03. The daily 38.2% Fib levels comes at 134.19, expected to provide resistance. Similarly, the daily 61.8% fib level is at 133.74, expected to provide resistance.
Note the levels of interest below:
- Pivot support is noted at 133.2, 132.18, 131.33
- Pivot resistance is noted at 135.08, 135.93, 136.95
| Levels | Levels.1 |
|---|---|
| Previous Daily High | 134.90 |
| Previous Daily Low | 133.03 |
| Previous Weekly High | 137.91 |
| Previous Weekly Low | 134.12 |
| Previous Monthly High | 136.92 |
| Previous Monthly Low | 128.08 |
| Daily Fibonacci 38.2% | 134.19 |
| Daily Fibonacci 61.8% | 133.74 |
| Daily Pivot Point S1 | 133.20 |
| Daily Pivot Point S2 | 132.18 |
| Daily Pivot Point S3 | 131.33 |
| Daily Pivot Point R1 | 135.08 |
| Daily Pivot Point R2 | 135.93 |
| Daily Pivot Point R3 | 136.95 |
[/s2If]
Join Our Telegram Group
")


