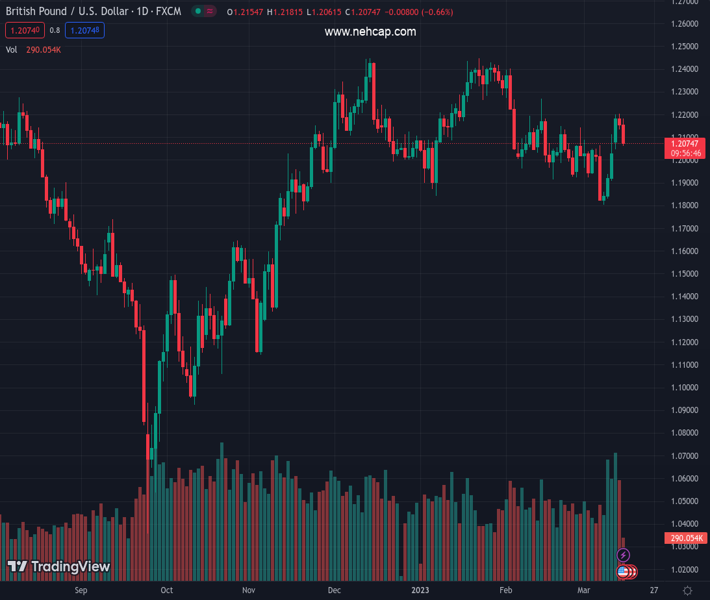
#GBPUSD @ 1.20666 A combination of factors drag away from a one-month high touched on Tuesday. (Pivot Orderbook analysis)
…
This is a premium post.
[s2If !current_user_can(access_s2member_level4)]Please register for PREMIUM VERSION HERE to read full post below containing analysis. In case of any error or you think you are not able to read the full post below, please email us at support#nehcap.com [lwa][/s2If] [s2If current_user_can(access_s2member_level4)]
- A combination of factors drag GBP/USD away from a one-month high touched on Tuesday.
- Bets that the BoE might pause its rate-hiking cycle and a stronger USD exert some pressure.
- Investors now look to the UK budget and important US macro releases for a fresh impetus.
The pair currently trades last at 1.20666.
The previous day high was 1.2204 while the previous day low was 1.2136. The daily 38.2% Fib levels comes at 1.2162, expected to provide resistance. Similarly, the daily 61.8% fib level is at 1.2178, expected to provide resistance.
The GBP/USD pair comes under some renewed selling pressure following an early uptick to the 1.2180 region and turns lower for the second successive day on Wednesday. Spot prices slide below the 1.2100 mark during the first half of the European session, with bears now looking to extend the overnight retracement slide from the 1.2200 round figure, or a one-month high.
The British Pound’s relative underperformance comes on the back of expectations that the Bank of England (BoE) will pause its rate-hiking cycle, which, in turn, acts as a headwind for the GBP/USD pair. In fact, the UK Office for National Statistics reported on Tuesday that annual growth in average total pay — including bonuses — slowed to 5.7% during the three months to January from 6% the previous month. Excluding bonuses, pay growth eased from 6.7% to 6.5%. This is seen as the first sign that UK wages are cooling and should allow the central bank to adopt a cautious approach amid a gloomy economic outlook.
The US Dollar, on the other hand, draws support from a further rise in the US Treasury bond yields, bolstered by reviving bets for at least a 25 bps rate hike by the Federal Reserve at its meeting on March 21-22. The expectations were fueled by the US CPI report released on Tuesday, which indicated that inflation isn’t coming down quite as fast as hoped. Adding to this, a fresh leg down in the US equity futures, amid concerns over a banking crisis in the US, provides a strong boost to the safe-haven buck. This, in turn, supports prospects for an extension of the GBP/USD pair’s retracement slide from the 1.2200 round figure.
Traders, however, seem reluctant to place aggressive bets and might prefer to wait for the UK government’s Spring Budget amid soaring inflation and a cost of living crisis. Apart from this, the US economic docket – featuring the release of the Producer Price Index (PPI), monthly Retail Sales figures and the Empire State Manufacturing Index – might provide some impetus to the GBP/USD pair later during the early North American session. Nevertheless, the aforementioned fundamental backdrop seems tilted firmly in favour of bears and suggests that the path of least resistance for spot prices is to the downside.
Technical Levels: Supports and Resistances
GBPUSD currently trading at 1.2101 at the time of writing. Pair opened at 1.2158 and is trading with a change of -0.47 % .
| Overview | Overview.1 | |
|---|---|---|
| 0 | Today last price | 1.2101 |
| 1 | Today Daily Change | -0.0057 |
| 2 | Today Daily Change % | -0.4700 |
| 3 | Today daily open | 1.2158 |
The pair is trading above its 20 Daily moving average @ 1.2015, below its 50 Daily moving average @ 1.2135 , above its 100 Daily moving average @ 1.2033 and above its 200 Daily moving average @ 1.1897
| Trends | Trends.1 | |
|---|---|---|
| 0 | Daily SMA20 | 1.2015 |
| 1 | Daily SMA50 | 1.2135 |
| 2 | Daily SMA100 | 1.2033 |
| 3 | Daily SMA200 | 1.1897 |
The previous day high was 1.2204 while the previous day low was 1.2136. The daily 38.2% Fib levels comes at 1.2162, expected to provide resistance. Similarly, the daily 61.8% fib level is at 1.2178, expected to provide resistance.
Note the levels of interest below:
- Pivot support is noted at 1.2128, 1.2097, 1.2059
- Pivot resistance is noted at 1.2196, 1.2235, 1.2265
| Levels | Levels.1 |
|---|---|
| Previous Daily High | 1.2204 |
| Previous Daily Low | 1.2136 |
| Previous Weekly High | 1.2114 |
| Previous Weekly Low | 1.1803 |
| Previous Monthly High | 1.2402 |
| Previous Monthly Low | 1.1915 |
| Daily Fibonacci 38.2% | 1.2162 |
| Daily Fibonacci 61.8% | 1.2178 |
| Daily Pivot Point S1 | 1.2128 |
| Daily Pivot Point S2 | 1.2097 |
| Daily Pivot Point S3 | 1.2059 |
| Daily Pivot Point R1 | 1.2196 |
| Daily Pivot Point R2 | 1.2235 |
| Daily Pivot Point R3 | 1.2265 |
[/s2If]
Join Our Telegram Group
")


