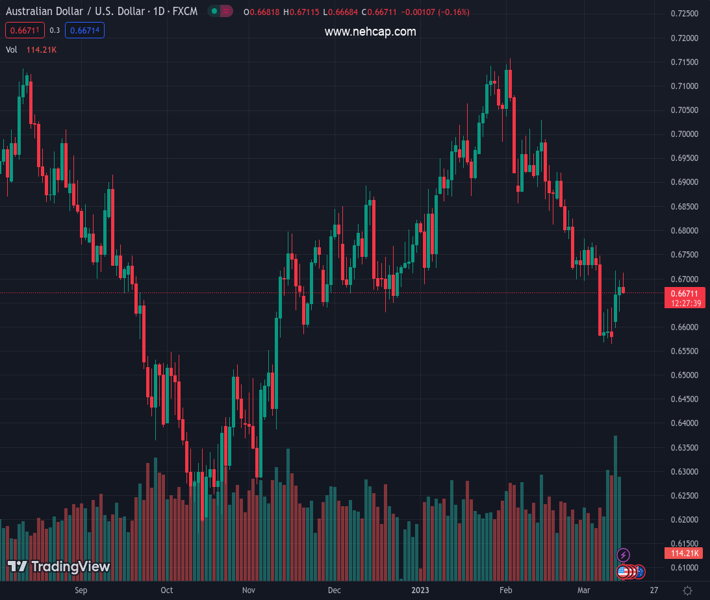
#AUDUSD @ 0.66701 fails to preserve/capitalize on its intraday uptick amid a modest USD strength. (Pivot Orderbook analysis)
…
This is a premium post.
[s2If !current_user_can(access_s2member_level4)]Please register for PREMIUM VERSION HERE to read full post below containing analysis. In case of any error or you think you are not able to read the full post below, please email us at support#nehcap.com [lwa][/s2If] [s2If current_user_can(access_s2member_level4)]
- AUD/USD fails to preserve/capitalize on its intraday uptick amid a modest USD strength.
- Hawkish Fed expectations push the US bond yields higher and underpin the Greenback.
- The RBA’s dovish shift supports prospects for some meaningful downside for the pair.
- Traders now look forward to important US macro releases for short-term opportunities.
The pair currently trades last at 0.66701.
The previous day high was 0.6696 while the previous day low was 0.6632. The daily 38.2% Fib levels comes at 0.6671, expected to provide resistance. Similarly, the daily 61.8% fib level is at 0.6656, expected to provide support.
The AUD/USD pair continues with its struggle to find acceptance above the 0.6700 round-figure mark and trims a part of its modest intraday gains back closer to the weekly high. The pair retreats to the lower end of its daily trading range during the early European session and is currently placed around the 0.6675-0.6670 region, nearly unchanged for the day.
The US Dollar attracts fresh buying amid reviving bets for a further policy tightening by the Federal Reserve and turns out to be a key factor acting as a headwind for the AUD/USD pair. Despite uncertainties over the US banking system, investors seem convinced that the Fed might still go ahead with a smaller 25 bps rate hike at its March policy meeting. The expectations were reaffirmed by the crucial US CPI report on Tuesday, which showed that inflation isn’t coming down quite as fast as hoped.
This, in turn, continues to push the US Treasury bond yields and lend some support to the Greenback. The AUD/USD bulls, meanwhile, seem rather unimpressed by the better-than-expected Chinese Retail Sales and Fixed Asset Investment data, indicating that certain facets of the world’s second-largest economy were on a steady path towards recovery. Even a generally positive risk tone, which tends to undermine the safe-haven buck, does little to benefit the risk-sensitive Australian Dollar.
Investors turned optimistic amid easing fears about a broader systemic crisis from the sudden collapse of Silicon Valley Bank (SVB). This led to the overnight relief rally on Wall Street and is evident from a stable performance around the European equity markets. The intraday price action, along with the Reserve Bank of Australia’s (RBA) dovish shift, signalling that it might be nearing the end of its rate-hiking cycle, suggests that the path of least resistance for the AUD/USD pair is to the downside.
Traders now look forward to the US economic docket, featuring the release of the Producer Price Index (PPI), monthly Retail Sales figures and the Empire State Manufacturing Index later during the early North American session. Apart from this, the US bond yields and the broader risk sentiment might influence the USD price dynamics, which, in turn, should produce short-term opportunities around the AUD/USD pair. The key focus, however, will remain on the FOMC monetary policy meeting, starting next Tuesday.
Technical Levels: Supports and Resistances
AUDUSD currently trading at 0.6675 at the time of writing. Pair opened at 0.6683 and is trading with a change of -0.12 % .
| Overview | Overview.1 | |
|---|---|---|
| 0 | Today last price | 0.6675 |
| 1 | Today Daily Change | -0.0008 |
| 2 | Today Daily Change % | -0.1200 |
| 3 | Today daily open | 0.6683 |
The pair remains strongly bearish on the daily time frame. It trades below the 20 SMA @ 0.6747, 50 SMA 0.6881, 100 SMA @ 0.6771 and 200 SMA @ 0.6772.
| Trends | Trends.1 | |
|---|---|---|
| 0 | Daily SMA20 | 0.6747 |
| 1 | Daily SMA50 | 0.6881 |
| 2 | Daily SMA100 | 0.6771 |
| 3 | Daily SMA200 | 0.6772 |
The previous day high was 0.6696 while the previous day low was 0.6632. The daily 38.2% Fib levels comes at 0.6671, expected to provide resistance. Similarly, the daily 61.8% fib level is at 0.6656, expected to provide support.
Note the levels of interest below:
- Pivot support is noted at 0.6644, 0.6606, 0.658
- Pivot resistance is noted at 0.6709, 0.6735, 0.6773
| Levels | Levels.1 |
|---|---|
| Previous Daily High | 0.6696 |
| Previous Daily Low | 0.6632 |
| Previous Weekly High | 0.6770 |
| Previous Weekly Low | 0.6564 |
| Previous Monthly High | 0.7158 |
| Previous Monthly Low | 0.6698 |
| Daily Fibonacci 38.2% | 0.6671 |
| Daily Fibonacci 61.8% | 0.6656 |
| Daily Pivot Point S1 | 0.6644 |
| Daily Pivot Point S2 | 0.6606 |
| Daily Pivot Point S3 | 0.6580 |
| Daily Pivot Point R1 | 0.6709 |
| Daily Pivot Point R2 | 0.6735 |
| Daily Pivot Point R3 | 0.6773 |
[/s2If]
Join Our Telegram Group
")


