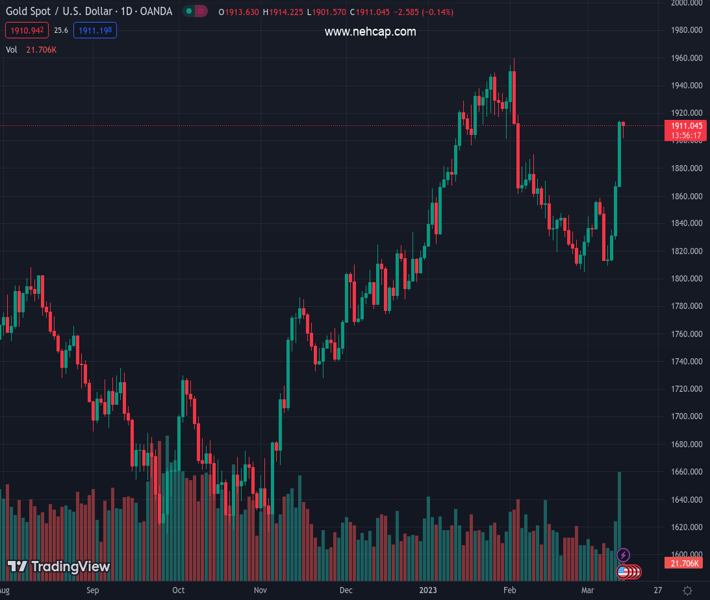
#XAUUSD @ 1,912.06 Gold price struggles to keep the early Asian session pullback from five-week high, picks up bids of late., @nehcap view: Bullish (Pivot Orderbook analysis)
…
This is a premium post.
[s2If !current_user_can(access_s2member_level4)]Please register for PREMIUM VERSION HERE to read full post below containing analysis. In case of any error or you think you are not able to read the full post below, please email us at support#nehcap.com [lwa][/s2If] [s2If current_user_can(access_s2member_level4)]
- Gold price struggles to keep the early Asian session pullback from five-week high, picks up bids of late.
- Interest rate futures suggest Fed policy pivot in March, versus the last week’s expectations of 50 bps rate hike.
- Corrective bounce in yields probe XAU/USD bulls ahead of US CPI for February.
The pair currently trades last at 1912.06.
The previous day high was 1914.67 while the previous day low was 1867.66. The daily 38.2% Fib levels comes at 1896.71, expected to provide support. Similarly, the daily 61.8% fib level is at 1885.62, expected to provide support.
Gold price (XAU/USD) remains mildly offered as traders struggle to justify mixed catalysts ahead of the key US Consumer Price Index (CPI) data during early Tuesday. That said, the XAU/USD drops 0.25% intraday to $1,909 during the first loss-making day in four heading into the European session.
The precious metal’s latest losses could be linked to the US Dollar’s corrective bounce while tracing the US Treasury bond yields. US 10-year Treasury bond yields print mild gains of around 3.58%, after bouncing off the monthly bottom of 3.418%, whereas the two-year counterpart rebounds from the lowest levels since September 2022 to print mild gains of around 4.19% by the press time. It should be noted that the US two-year Treasury bond yields dropped the most since 1987 the previous day.
On the other hand, the US Dollar Index (DXY) bounces off a one-month low to snap a three-day downtrend near 103.90, up 0.27% intraday at the latest.
It’s worth observing that the fears emanating from the Silicon Valley Bank (SVB) and the Signature Bank fallouts have recently reversed the hawkish expectations from the Federal Reserve (Fed) and challenged the DXY bulls of late. “Traders see 33% chance Fed holds rates this month, market pricing shows rate cuts expected as early as June,” said CME. On the same line Reuters mentioned that the US Fed Fund Futures have priced in a 69% chance of a 25-bps hike at next week’s Fed policy meeting, with a more than 30% probability of a pause,” said Reuters. The news also added that the market last week was poised for a 50-bps increase prior to the SVB collapse.
Also likely to weigh on the Gold price could be the latest fears surrounding China and Russia as the UK, the US and Australia over the nuclear submarine issues while Washington meets Taiwan’s leader. However, hopes of more investment in China and the recently increasing hopes of the dragon nation’s gradual recovery, as backed by Bloomberg, favor the XAU/USD bulls.
Moving on, the US CPI will be more important for the USD/CHF pair traders as the Fed bets have already reversed. As per the market forecasts, the headline US CPI is likely to ease to 6.0% YoY versus 6.4% prior while CPI ex Food & Energy may slide to 5.5% YoY from 5.6% prior.
The downside break of a two-day-old ascending trend channel joins a bearish MACD signal and firmer RSI to keep Gold sellers hopeful. However, the 21-bar Exponential Moving Average (EMA) restricts the immediate downside of the XAU/USD near the $1,900 threshold.
Following that, the 38.2% Fibonacci retracement level of the metal’s upside from February 28, close to $1,873, can act as a buffer before directing the Gold price towards the March 06 swing high of near $1,858.
It should be noted, however, that the 200-EMA level surrounding $1,851 could act as the last defense for the XAU/USD buyers.
Alternatively, Gold price recovery remains elusive unless the quote stays below the stated channel’s lower line, close to $1,921 at the latest.
In a case where the XAU/USD remains firmer past $1,921, the previous monthly high surrounding $1,960 could lure the bulls.
Trend: Bullish
Technical Levels: Supports and Resistances
XAUUSD currently trading at 1908.3 at the time of writing. Pair opened at 1913.77 and is trading with a change of -0.29% % .
| Overview | Overview.1 | |
|---|---|---|
| 0 | Today last price | 1908.3 |
| 1 | Today Daily Change | -5.47 |
| 2 | Today Daily Change % | -0.29% |
| 3 | Today daily open | 1913.77 |
The pair remains strongly bullish on the daily timeframe. It trades above its 20 SMA @ 1838.45, 50 SMA 1872.87, 100 SMA @ 1813.1 and 200 SMA @ 1775.42.
| Trends | Trends.1 | |
|---|---|---|
| 0 | Daily SMA20 | 1838.45 |
| 1 | Daily SMA50 | 1872.87 |
| 2 | Daily SMA100 | 1813.10 |
| 3 | Daily SMA200 | 1775.42 |
The previous day high was 1914.67 while the previous day low was 1867.66. The daily 38.2% Fib levels comes at 1896.71, expected to provide support. Similarly, the daily 61.8% fib level is at 1885.62, expected to provide support.
Note the levels of interest below:
- Pivot support is noted at 1882.73, 1851.69, 1835.72
- Pivot resistance is noted at 1929.74, 1945.71, 1976.75
| Levels | Levels.1 |
|---|---|
| Previous Daily High | 1914.67 |
| Previous Daily Low | 1867.66 |
| Previous Weekly High | 1870.09 |
| Previous Weekly Low | 1809.46 |
| Previous Monthly High | 1959.80 |
| Previous Monthly Low | 1804.76 |
| Daily Fibonacci 38.2% | 1896.71 |
| Daily Fibonacci 61.8% | 1885.62 |
| Daily Pivot Point S1 | 1882.73 |
| Daily Pivot Point S2 | 1851.69 |
| Daily Pivot Point S3 | 1835.72 |
| Daily Pivot Point R1 | 1929.74 |
| Daily Pivot Point R2 | 1945.71 |
| Daily Pivot Point R3 | 1976.75 |
[/s2If]
Join Our Telegram Group
")


