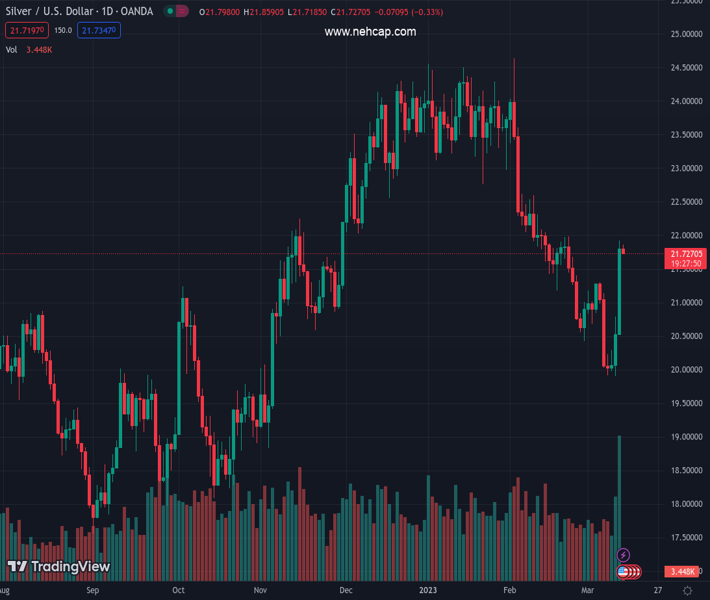
#XAGUSD @ 21.728 Silver price eases around monthly top after rising the most since early November 2022., @nehcap view: Further upside expected (Pivot Orderbook analysis)
…
This is a premium post.
[s2If !current_user_can(access_s2member_level4)]Please register for PREMIUM VERSION HERE to read full post below containing analysis. In case of any error or you think you are not able to read the full post below, please email us at support#nehcap.com [lwa][/s2If] [s2If current_user_can(access_s2member_level4)]
- Silver price eases around monthly top after rising the most since early November 2022.
- Convergence of 50-day, 100-day EMAs challenge XAG/USD bulls.
- Bullish MACD signals, sustained bounce off multi-day-old support line keep Silver buyers hopeful.
The pair currently trades last at 21.728.
The previous day high was 21.93 while the previous day low was 20.54. The daily 38.2% Fib levels comes at 21.4, expected to provide support. Similarly, the daily 61.8% fib level is at 21.07, expected to provide support.
Silver price (XAG/USD) slides to around $21.70 as bulls take a breather following the biggest daily jump in more than four months. With this, the bright metal traces the Gold price while probing XAG/USD bulls ahead of the key US inflation data.
Also read: Gold Price Forecast: XAU/USD retreats on sluggish Treasury yields ahead of United States inflation
That said, a convergence of the 50-day and the 100-day Exponential Moving Average (EMA) challenges the immediate upside of the Silver price near $21.90. Adding strength to the stated resistance is the 38.2% Fibonacci retracement level of the metal’s run-up from September 2022 to February 2023.
It should, however, be noted that the XAG/USD rebound from the 5.5-month-old upward-sloping trend line, around $20.00 by the press time, joins the bullish MACD signals to keep the Silver buyers hopeful.
Given the quote’s successful break of the $21.90 hurdle, as well as sustained trading beyond the 22.00 round figure, Silver bulls can aim for the 23.6% Fibonacci retracement level surrounding $23.00. Following that, a rally toward the 2023 peak surrounding $24.65 can’t be ruled out.
On the contrary, the Silver price pullback can aim for the 50% and 61.8% Fibonacci retracements, respectively near $21.10 and $20.25 at the latest, before challenging the previously mentioned multi-day-old support line, close to $20.00 by the press time.
It’s worth observing, though, that the XAG/USD weakness below $20.00 could make it vulnerable to testing the November 2022 low of near $18.80. During the fall, the monthly bottom surrounding $19.90 can act as a validation point.
Trend: Further upside expected
Technical Levels: Supports and Resistances
XAGUSD currently trading at 21.82 at the time of writing. Pair opened at 21.82 and is trading with a change of 0.00% % .
| Overview | Overview.1 | |
|---|---|---|
| 0 | Today last price | 21.82 |
| 1 | Today Daily Change | 0.00 |
| 2 | Today Daily Change % | 0.00% |
| 3 | Today daily open | 21.82 |
The pair is trading above its 20 Daily moving average @ 21.12, below its 50 Daily moving average @ 22.47 , below its 100 Daily moving average @ 22.22 and above its 200 Daily moving average @ 20.94
| Trends | Trends.1 | |
|---|---|---|
| 0 | Daily SMA20 | 21.12 |
| 1 | Daily SMA50 | 22.47 |
| 2 | Daily SMA100 | 22.22 |
| 3 | Daily SMA200 | 20.94 |
The previous day high was 21.93 while the previous day low was 20.54. The daily 38.2% Fib levels comes at 21.4, expected to provide support. Similarly, the daily 61.8% fib level is at 21.07, expected to provide support.
Note the levels of interest below:
- Pivot support is noted at 20.93, 20.04, 19.54
- Pivot resistance is noted at 22.32, 22.82, 23.7
| Levels | Levels.1 |
|---|---|
| Previous Daily High | 21.93 |
| Previous Daily Low | 20.54 |
| Previous Weekly High | 21.31 |
| Previous Weekly Low | 19.90 |
| Previous Monthly High | 24.64 |
| Previous Monthly Low | 20.42 |
| Daily Fibonacci 38.2% | 21.40 |
| Daily Fibonacci 61.8% | 21.07 |
| Daily Pivot Point S1 | 20.93 |
| Daily Pivot Point S2 | 20.04 |
| Daily Pivot Point S3 | 19.54 |
| Daily Pivot Point R1 | 22.32 |
| Daily Pivot Point R2 | 22.82 |
| Daily Pivot Point R3 | 23.70 |
[/s2If]
Join Our Telegram Group
")


