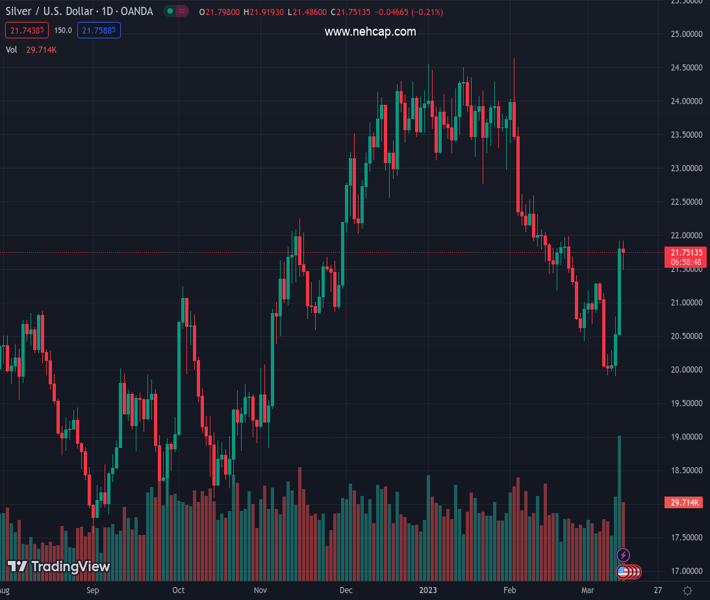
#XAGUSD @ 21.715 Silver seesaws between tepid gains/minor losses below a one-month high touched on Monday. (Pivot Orderbook analysis)
…
This is a premium post.
[s2If !current_user_can(access_s2member_level4)]Please register for PREMIUM VERSION HERE to read full post below containing analysis. In case of any error or you think you are not able to read the full post below, please email us at support#nehcap.com [lwa][/s2If] [s2If current_user_can(access_s2member_level4)]
- Silver seesaws between tepid gains/minor losses below a one-month high touched on Monday.
- Bulls need to wait for a sustained strength beyond the $22.00 mark before placing fresh bets.
- A convincing break below the 23.6% Fibo. will shift the bias back in favour of bearish traders.
The pair currently trades last at 21.715.
The previous day high was 21.93 while the previous day low was 20.54. The daily 38.2% Fib levels comes at 21.4, expected to provide support. Similarly, the daily 61.8% fib level is at 21.07, expected to provide support.
Silver reverses an early North American session dip to the $21.50-$21.45 region and jumps back closer to a one-month high touched the previous day. The white metal, however, remains below the $22.00 round-figure mark and is currently placed around the 38.2% Fibonacci retracement level of the recent downfall from the $24.65 area, or a multi-month peak touched in February.
From a technical perspective, oscillators on the daily chart have just started gaining positive traction and support prospects for additional gains. Bulls, however, might still wait for a sustained move beyond the 200-period Simple Moving Average (SMA) on the 4-hour chart before placing fresh bets. The XAG/USD might then aim to surpass the 50% Fibo. level, around the $22.30 region, and test the next relevant hurdle near the $22.55-$22.60 supply zone. This is followed by 61.8% Fibo. level, just ahead of the $23.00 round figure, which if cleared decisively will negate any near-term bearish bias and pave the way for a further near-term appreciating move.
On the flip side, any weakness below the daily low, around the $21.50-$21.45 zone, might now find some support near the $21.25 area ahead of the $21.00 mark, or the 23.6% Fibo. level. The latter should act as a strong base for the XAG/USD. A convincing break below will suggest that the recent recovery from levels just below the $20.00 psychological mark, or the YTD low touched last week, has run its course. The subsequent slide could drag the XAG/USD towards the $19.60 intermediate support en route to the $19.00 round-figure mark.
The downward trajectory could get extended further towards the $18.80-$18.75 zone before the XAG/USD eventually drops to the next relevant support near the $18.30-$18.25 zone and the $18.00 level.
Technical Levels: Supports and Resistances
XAGUSD currently trading at 21.65 at the time of writing. Pair opened at 21.82 and is trading with a change of -0.78 % .
| Overview | Overview.1 | |
|---|---|---|
| 0 | Today last price | 21.65 |
| 1 | Today Daily Change | -0.17 |
| 2 | Today Daily Change % | -0.78 |
| 3 | Today daily open | 21.82 |
The pair is trading above its 20 Daily moving average @ 21.12, below its 50 Daily moving average @ 22.47 , below its 100 Daily moving average @ 22.22 and above its 200 Daily moving average @ 20.94
| Trends | Trends.1 | |
|---|---|---|
| 0 | Daily SMA20 | 21.12 |
| 1 | Daily SMA50 | 22.47 |
| 2 | Daily SMA100 | 22.22 |
| 3 | Daily SMA200 | 20.94 |
The previous day high was 21.93 while the previous day low was 20.54. The daily 38.2% Fib levels comes at 21.4, expected to provide support. Similarly, the daily 61.8% fib level is at 21.07, expected to provide support.
Note the levels of interest below:
- Pivot support is noted at 20.93, 20.04, 19.54
- Pivot resistance is noted at 22.32, 22.82, 23.7
| Levels | Levels.1 |
|---|---|
| Previous Daily High | 21.93 |
| Previous Daily Low | 20.54 |
| Previous Weekly High | 21.31 |
| Previous Weekly Low | 19.90 |
| Previous Monthly High | 24.64 |
| Previous Monthly Low | 20.42 |
| Daily Fibonacci 38.2% | 21.40 |
| Daily Fibonacci 61.8% | 21.07 |
| Daily Pivot Point S1 | 20.93 |
| Daily Pivot Point S2 | 20.04 |
| Daily Pivot Point S3 | 19.54 |
| Daily Pivot Point R1 | 22.32 |
| Daily Pivot Point R2 | 22.82 |
| Daily Pivot Point R3 | 23.70 |
[/s2If]
Join Our Telegram Group
")


