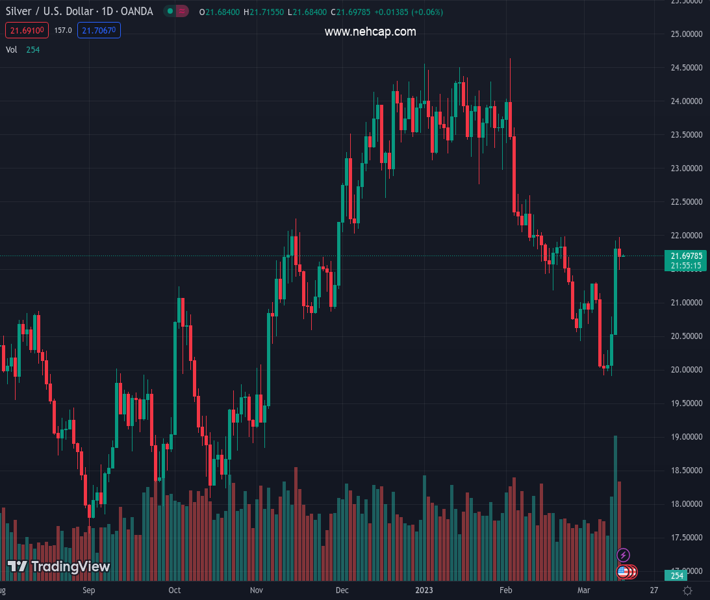
#XAGUSD @ 21.694 Silver price remains steady at around $21.70s despite losing 0.39% on Tuesday. (Pivot Orderbook analysis)
…
This is a premium post.
[s2If !current_user_can(access_s2member_level4)]Please register for PREMIUM VERSION HERE to read full post below containing analysis. In case of any error or you think you are not able to read the full post below, please email us at support#nehcap.com [lwa][/s2If] [s2If current_user_can(access_s2member_level4)]
- Silver price remains steady at around $21.70s despite losing 0.39% on Tuesday.
- The confluence of the 200/100/50-day EMAs would be solid resistance to break.
- XAG/USD Price Analysis: In the short term, neutral biased.
The pair currently trades last at 21.694.
The previous day high was 21.93 while the previous day low was 20.54. The daily 38.2% Fib levels comes at 21.4, expected to provide support. Similarly, the daily 61.8% fib level is at 21.07, expected to provide support.
XAG/USD stays firm after rallying more than 6% on Monday on investors’ flight to safety following the collapse of the Silicon Valley Bank and Signature Bank. Nevertheless, worries about a potential spread had waned. At the time of writing, the XAG/USD exchanges hands at $21.68 a troy ounce.
Silver prices retreated from weekly highs reached during the day at $21.96 due to several technical reasons. The 200, 50 and 100-day Exponential Moving Averages (EMAs) confluence around the $21.79-86 area capped the white metal climb. Therefore, the XAG/USD closed Tuesday’s session at around $21.68, below the 200-day EMA. That said, the XAG/USD is neutral to upward bias, though a daily close above the 200-day EMA must shift the bias neutral upwards.
On the upside, the XAG/USD first resistance would be the 200-day EMA at $21.79. Once cleared, the next supply zone would be the 50/100-day EMAs intersection, at $21.84-86, followed by the $22.00 figure.
On the flip side, the XAG/USD first support would be the 20-day EMA at $21.26. A breach of the latter will expose the March 10 daily high turned support at $20.78, followed by the March 13 low at $20.50
Technical Levels: Supports and Resistances
XAGUSD currently trading at 21.71 at the time of writing. Pair opened at 21.82 and is trading with a change of -0.5 % .
| Overview | Overview.1 | |
|---|---|---|
| 0 | Today last price | 21.71 |
| 1 | Today Daily Change | -0.11 |
| 2 | Today Daily Change % | -0.50 |
| 3 | Today daily open | 21.82 |
The pair is trading above its 20 Daily moving average @ 21.12, below its 50 Daily moving average @ 22.47 , below its 100 Daily moving average @ 22.22 and above its 200 Daily moving average @ 20.94
| Trends | Trends.1 | |
|---|---|---|
| 0 | Daily SMA20 | 21.12 |
| 1 | Daily SMA50 | 22.47 |
| 2 | Daily SMA100 | 22.22 |
| 3 | Daily SMA200 | 20.94 |
The previous day high was 21.93 while the previous day low was 20.54. The daily 38.2% Fib levels comes at 21.4, expected to provide support. Similarly, the daily 61.8% fib level is at 21.07, expected to provide support.
Note the levels of interest below:
- Pivot support is noted at 20.93, 20.04, 19.54
- Pivot resistance is noted at 22.32, 22.82, 23.7
| Levels | Levels.1 |
|---|---|
| Previous Daily High | 21.93 |
| Previous Daily Low | 20.54 |
| Previous Weekly High | 21.31 |
| Previous Weekly Low | 19.90 |
| Previous Monthly High | 24.64 |
| Previous Monthly Low | 20.42 |
| Daily Fibonacci 38.2% | 21.40 |
| Daily Fibonacci 61.8% | 21.07 |
| Daily Pivot Point S1 | 20.93 |
| Daily Pivot Point S2 | 20.04 |
| Daily Pivot Point S3 | 19.54 |
| Daily Pivot Point R1 | 22.32 |
| Daily Pivot Point R2 | 22.82 |
| Daily Pivot Point R3 | 23.70 |
[/s2If]
Join Our Telegram Group
")


