#USDMXN @ 18.9106 remains sidelined after refreshing five-week top the previous day., @nehcap view: Further upside expected (Pivot Orderbook analysis)
…
This is a premium post.
[s2If !current_user_can(access_s2member_level4)]Please register for PREMIUM VERSION HERE to read full post below containing analysis. In case of any error or you think you are not able to read the full post below, please email us at support#nehcap.com [lwa][/s2If] [s2If current_user_can(access_s2member_level4)]
- USD/MXN remains sidelined after refreshing five-week top the previous day.
- Upbeat oscillators, clear upside break of previous key resistance line keep Mexican Peso pair buyers hopeful.
- Sellers need validation from 18.65 to retake control.
The pair currently trades last at 18.9106.
The previous day high was 19.1812 while the previous day low was 18.2397. The daily 38.2% Fib levels comes at 18.8216, expected to provide support. Similarly, the daily 61.8% fib level is at 18.5994, expected to provide support.
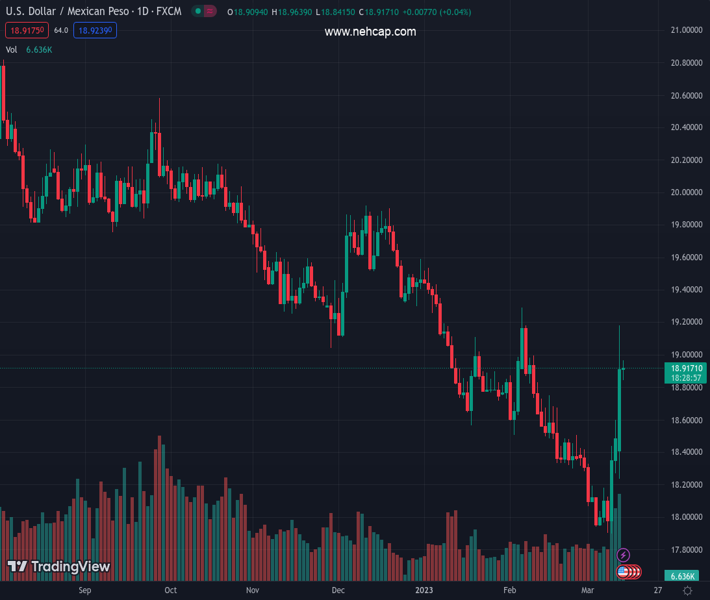
USD/MXN grinds near 18.90 as bulls take a breather after a three-day rebound from the multi-month low. Even so, the Mexican Peso (MXN) pair remains on the bull’s radar as it defends the previous day’s bullish signals.
That said, a daily closing beyond a downward-sloping resistance line from late December 2022, now immediate support around 18.85, favors USD/MXN bulls. Adding strength to the upside bias is the bullish MACD signals and the firmer RSI (14) line, not overbought.
It should be noted that the USD/MXN pair failed to cross the 100-DMA hurdle, near 19.10 at the latest, during the previous day’s run-up. However, the aforementioned bullish catalysts hint at the pair’s sustained break of the key resistance.
Even so, the 61.8% Fibonacci retracement level of the pair’s December 2022 to March 2023 downside, close to 19.15, can act as an extra filter to the north. Following that, the previous monthly top surrounding 19.30 appears the last defense of the USD/MXN bears.
Meanwhile, the pair’s pullback moves appear unimpressive till staying beyond the aforementioned resistance-turned-support line near 18.85.
However, major attention should be given to a convergence of the 50-DMA and 38.2% Fibonacci retracement, near 18.65, to convince the USD/MXN bears to refresh the multi-month low marked the last week around 17.90.
Trend: Further upside expected
Technical Levels: Supports and Resistances
USDMXN currently trading at 18.9015 at the time of writing. Pair opened at 18.912 and is trading with a change of -0.06% % .
| Overview | Overview.1 | |
|---|---|---|
| 0 | Today last price | 18.9015 |
| 1 | Today Daily Change | -0.0105 |
| 2 | Today Daily Change % | -0.06% |
| 3 | Today daily open | 18.912 |
The pair is trading above its 20 Daily moving average @ 18.3351, above its 50 Daily moving average @ 18.6751 , below its 100 Daily moving average @ 19.113 and below its 200 Daily moving average @ 19.6429
| Trends | Trends.1 | |
|---|---|---|
| 0 | Daily SMA20 | 18.3351 |
| 1 | Daily SMA50 | 18.6751 |
| 2 | Daily SMA100 | 19.1130 |
| 3 | Daily SMA200 | 19.6429 |
The previous day high was 19.1812 while the previous day low was 18.2397. The daily 38.2% Fib levels comes at 18.8216, expected to provide support. Similarly, the daily 61.8% fib level is at 18.5994, expected to provide support.
Note the levels of interest below:
- Pivot support is noted at 18.3741, 17.8361, 17.4325
- Pivot resistance is noted at 19.3156, 19.7192, 20.2571
| Levels | Levels.1 |
|---|---|
| Previous Daily High | 19.1812 |
| Previous Daily Low | 18.2397 |
| Previous Weekly High | 18.5957 |
| Previous Weekly Low | 17.8977 |
| Previous Monthly High | 19.2901 |
| Previous Monthly Low | 18.2954 |
| Daily Fibonacci 38.2% | 18.8216 |
| Daily Fibonacci 61.8% | 18.5994 |
| Daily Pivot Point S1 | 18.3741 |
| Daily Pivot Point S2 | 17.8361 |
| Daily Pivot Point S3 | 17.4325 |
| Daily Pivot Point R1 | 19.3156 |
| Daily Pivot Point R2 | 19.7192 |
| Daily Pivot Point R3 | 20.2571 |
[/s2If]
Join Our Telegram Group
")


