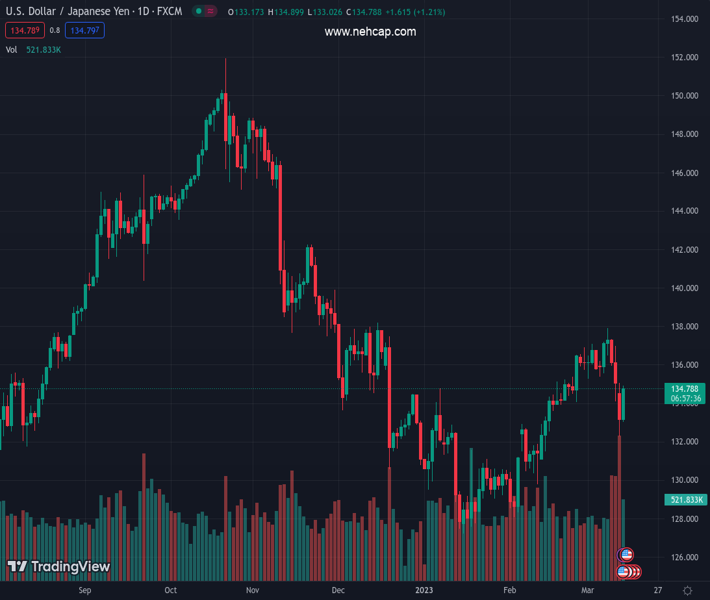
#USDJPY @ 134.794 US Dollar gains momentum after US inflation numbers. (Pivot Orderbook analysis)
…
This is a premium post.
[s2If !current_user_can(access_s2member_level4)]Please register for PREMIUM VERSION HERE to read full post below containing analysis. In case of any error or you think you are not able to read the full post below, please email us at support#nehcap.com [lwa][/s2If] [s2If current_user_can(access_s2member_level4)]
- US Dollar gains momentum after US inflation numbers.
- US CPI rises mostly in line with expectation in February.
- USD/JPY up 250 pips from Monday’s low, looking at 135.00.
The pair currently trades last at 134.794.
The previous day high was 135.05 while the previous day low was 132.29. The daily 38.2% Fib levels comes at 133.34, expected to provide support. Similarly, the daily 61.8% fib level is at 133.99, expected to provide support.
The USD/JPY broke a range after the beginning of the American session and following the release of US CPI numbers. The pair is trading above 134.70, at daily highs as the US dollar strengthens.
US February Consumer Price Index rose 0.4% in February, as expected, while the annual rate slowed down from 6.4% to 6%. The core CPI rose 0.5%, slightly above the 0.4% of market consensus.
The US Dollar stayed relatively quiet immediately after the report. However, the Greenback gained momentum later as US yields moved further to the upside. US Treasury bonds are erasing most of Monday’s gains. The rebound in yields is fueling the USD/JPY.
“Inflation has peaked – but that is not news anymore. The issue is that price rises are not falling, just becoming sticky. Moreover, the peak in yearly inflation remains at risk if Core CPI comes out above 0.3%”, explained Yohay Elam, analyst at FXStreet. Just a week ago the question regarding the Fed was 25 or 50bp rate hike. Now is it no change or 25bp. According to the market’s response so far to CPI, there still is a chance of a hike. More US inflation data is due on Wednesday with the Produce Price Index. Also Retail Sales numbers will be released.
The USD/JPY is erasing Monday’s losses and is approaching the 20-day Simple Moving Average (135.40). The intraday outlook is bullish, however the main picture offers mixed signs. If the move higher extends above 135.60, it could gain more momentum. On the contrary, a slide below 133.50 would expose the three-week low it hit on Monday ay 132.26.
Technical Levels: Supports and Resistances
USDJPY currently trading at 134.48 at the time of writing. Pair opened at 133.2 and is trading with a change of 0.96 % .
| Overview | Overview.1 | |
|---|---|---|
| 0 | Today last price | 134.48 |
| 1 | Today Daily Change | 1.28 |
| 2 | Today Daily Change % | 0.96 |
| 3 | Today daily open | 133.20 |
The pair is trading below its 20 Daily moving average @ 135.3, above its 50 Daily moving average @ 132.46 , below its 100 Daily moving average @ 135.83 and below its 200 Daily moving average @ 137.49
| Trends | Trends.1 | |
|---|---|---|
| 0 | Daily SMA20 | 135.30 |
| 1 | Daily SMA50 | 132.46 |
| 2 | Daily SMA100 | 135.83 |
| 3 | Daily SMA200 | 137.49 |
The previous day high was 135.05 while the previous day low was 132.29. The daily 38.2% Fib levels comes at 133.34, expected to provide support. Similarly, the daily 61.8% fib level is at 133.99, expected to provide support.
Note the levels of interest below:
- Pivot support is noted at 131.97, 130.75, 129.21
- Pivot resistance is noted at 134.74, 136.28, 137.5
| Levels | Levels.1 |
|---|---|
| Previous Daily High | 135.05 |
| Previous Daily Low | 132.29 |
| Previous Weekly High | 137.91 |
| Previous Weekly Low | 134.12 |
| Previous Monthly High | 136.92 |
| Previous Monthly Low | 128.08 |
| Daily Fibonacci 38.2% | 133.34 |
| Daily Fibonacci 61.8% | 133.99 |
| Daily Pivot Point S1 | 131.97 |
| Daily Pivot Point S2 | 130.75 |
| Daily Pivot Point S3 | 129.21 |
| Daily Pivot Point R1 | 134.74 |
| Daily Pivot Point R2 | 136.28 |
| Daily Pivot Point R3 | 137.50 |
[/s2If]
Join Our Telegram Group
")


