#USDCNH @ 6.86838 portrays corrective bounce near one-month low, mildly bid of late., @nehcap view: Further downside expected (Pivot Orderbook analysis)
…
This is a premium post.
[s2If !current_user_can(access_s2member_level4)]Please register for PREMIUM VERSION HERE to read full post below containing analysis. In case of any error or you think you are not able to read the full post below, please email us at support#nehcap.com [lwa][/s2If] [s2If current_user_can(access_s2member_level4)]
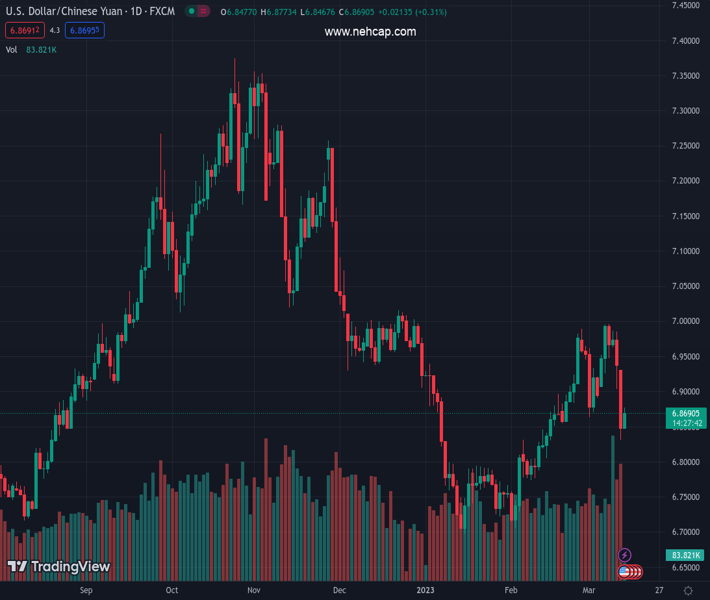
- USD/CNH portrays corrective bounce near one-month low, mildly bid of late.
- 50-DMA probes sellers but clear downside break of five-week-old ascending trend line, bearish MACD signals push back buyers.
- 100-DMA, monthly high act as final defence of China Yuan pair bears.
The pair currently trades last at 6.86838.
The previous day high was 6.9394 while the previous day low was 6.8316. The daily 38.2% Fib levels comes at 6.8728, expected to provide resistance. Similarly, the daily 61.8% fib level is at 6.8982, expected to provide resistance.
USD/CNH prints mild gains around 6.8660 as it struggles to defend the bounce off a one-month low during early Tuesday. In doing so, the offshore Chinese Yuan (CNH) pair justifies the bearish MACD signals, as well as the downside break of a five-week-old ascending support line, now resistance, while portraying a rebound from the 50-DMA.
That said, the USD/CNH pair’s latest recovery remains elusive unless the quote stays below the support-turned-resistance line from early February, around 6.9350 by the press time.
Even if the Yuan pair crosses the 6.9350 hurdle, the 100-DMA and the monthly high, respectively around 6.9620 and 6.9970 could test the bulls.
It should be observed that the 7.0000 psychological magnet acts as an extra upside filter before giving control to the USD/CNH bulls.
On the flip side, a daily closing below the 50-DMA, around 6.8360 at the latest, appears necessary to recall the bears.
Following that, multiple tops marked during late January around 6.7900 can act as an intermediate halt before directing the USD/CNH bears towards the year 2023 low, marked in January around 6.6975.
Overall, USD/CNH remains on the bear’s radar even if the 50-DMA challenges the pair’s immediate downside.
Trend: Further downside expected
Technical Levels: Supports and Resistances
USDCNH currently trading at 6.8614 at the time of writing. Pair opened at 6.8516 and is trading with a change of 0.14% % .
| Overview | Overview.1 | |
|---|---|---|
| 0 | Today last price | 6.8614 |
| 1 | Today Daily Change | 0.0098 |
| 2 | Today Daily Change % | 0.14% |
| 3 | Today daily open | 6.8516 |
The pair is trading below its 20 Daily moving average @ 6.9143, above its 50 Daily moving average @ 6.8375 , below its 100 Daily moving average @ 6.9667 and below its 200 Daily moving average @ 6.9246
| Trends | Trends.1 | |
|---|---|---|
| 0 | Daily SMA20 | 6.9143 |
| 1 | Daily SMA50 | 6.8375 |
| 2 | Daily SMA100 | 6.9667 |
| 3 | Daily SMA200 | 6.9246 |
The previous day high was 6.9394 while the previous day low was 6.8316. The daily 38.2% Fib levels comes at 6.8728, expected to provide resistance. Similarly, the daily 61.8% fib level is at 6.8982, expected to provide resistance.
Note the levels of interest below:
- Pivot support is noted at 6.8091, 6.7665, 6.7014
- Pivot resistance is noted at 6.9168, 6.9819, 7.0245
| Levels | Levels.1 |
|---|---|
| Previous Daily High | 6.9394 |
| Previous Daily Low | 6.8316 |
| Previous Weekly High | 6.9970 |
| Previous Weekly Low | 6.8966 |
| Previous Monthly High | 6.9898 |
| Previous Monthly Low | 6.7056 |
| Daily Fibonacci 38.2% | 6.8728 |
| Daily Fibonacci 61.8% | 6.8982 |
| Daily Pivot Point S1 | 6.8091 |
| Daily Pivot Point S2 | 6.7665 |
| Daily Pivot Point S3 | 6.7014 |
| Daily Pivot Point R1 | 6.9168 |
| Daily Pivot Point R2 | 6.9819 |
| Daily Pivot Point R3 | 7.0245 |
[/s2If]
Join Our Telegram Group
")


