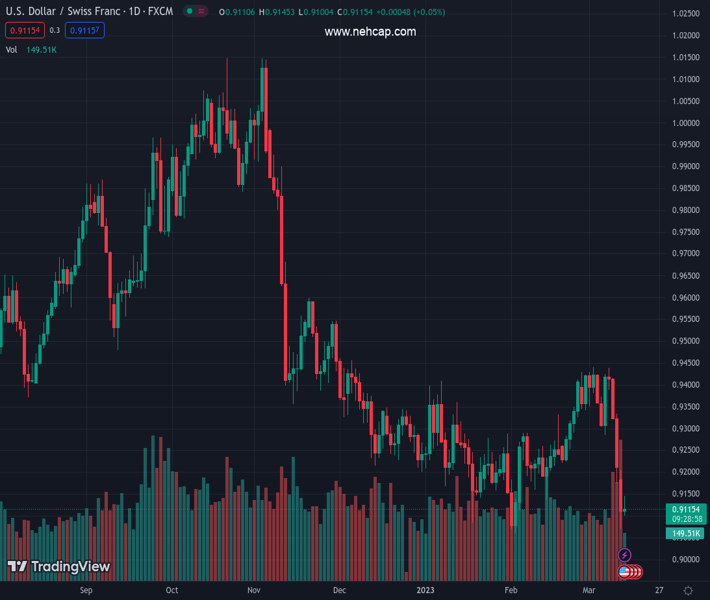
#USDCHF @ 0.91130 remains depressed near its lowest level since early February touched on Monday. (Pivot Orderbook analysis)
…
This is a premium post.
[s2If !current_user_can(access_s2member_level4)]Please register for PREMIUM VERSION HERE to read full post below containing analysis. In case of any error or you think you are not able to read the full post below, please email us at support#nehcap.com [lwa][/s2If] [s2If current_user_can(access_s2member_level4)]
- USD/CHF remains depressed near its lowest level since early February touched on Monday.
- Rebounding US bond yields revives the USD demand and limits the downside for the major.
- Traders also seem reluctant and prefer to wait for the release of the crucial US CPI report.
The pair currently trades last at 0.91130.
The previous day high was 0.9214 while the previous day low was 0.9072. The daily 38.2% Fib levels comes at 0.9126, expected to provide resistance. Similarly, the daily 61.8% fib level is at 0.916, expected to provide resistance.
The USD/CHF pair attracts fresh selling following an early uptick to the 0.9145 region on Tuesday and remains on the defensive through the mid-European session on Tuesday. The pair is currently placed around the 0.9100 mark, down over 0.10% for the day and well within the striking distance of its lowest level since early February touched on Monday.
The downside for the USD/CHF pair, however, seems cushioned, at least for the time being, amid resurgent US Dollar (USD) demand, bolstered by a goodish pickup in the US Treasury bond yields. The uptick in the US bond yields comes in the wake of easing fears of a broader systemic crisis, especially after the US authorities moved to limit the fallout from the sudden collapse of Silicon Valley Bank (SVB). Apart from this, a recovery in the global risk sentiment – as depicted by a generally positive tone around the equity markets – undermines the safe-haven Swiss Franc (CHF) and turns out to be another factor lending some support to the major.
Traders also seem reluctant to place aggressive bets and prefer to wait on the sidelines ahead of the release of the latest US consumer inflation figures, due later during the early North American session. The crucial US CPI data will play a key role in influencing the near-term USD price dynamics and provide some meaningful impetus to the USD/CHF pair ahead of a two-day FOMC policy meeting, starting next Tuesday. In the meantime, expectations that the Fed will slow, if not halt, its interest rate-hiking cycle in the wake of the strain on the US banking system could keep a lid on the US bond yields and hold back the USD bulls from placing aggressive bets.
The aforementioned fundamental backdrop suggests that the path of least resistance for the USD/CHF pair is to the downside. Bearish traders, however, are likely to wait for acceptance below the 0.9100 mark before placing fresh bets and positioning for an extension of the recent sharp pullback from the 0.9435-0.9440 supply zone, or the YTD peak touched last week.
Technical Levels: Supports and Resistances
USDCHF currently trading at 0.9111 at the time of writing. Pair opened at 0.9118 and is trading with a change of -0.08 % .
| Overview | Overview.1 | |
|---|---|---|
| 0 | Today last price | 0.9111 |
| 1 | Today Daily Change | -0.0007 |
| 2 | Today Daily Change % | -0.0800 |
| 3 | Today daily open | 0.9118 |
The pair remains strongly bearish on the daily time frame. It trades below the 20 SMA @ 0.9315, 50 SMA 0.9264, 100 SMA @ 0.9393 and 200 SMA @ 0.9558.
| Trends | Trends.1 | |
|---|---|---|
| 0 | Daily SMA20 | 0.9315 |
| 1 | Daily SMA50 | 0.9264 |
| 2 | Daily SMA100 | 0.9393 |
| 3 | Daily SMA200 | 0.9558 |
The previous day high was 0.9214 while the previous day low was 0.9072. The daily 38.2% Fib levels comes at 0.9126, expected to provide resistance. Similarly, the daily 61.8% fib level is at 0.916, expected to provide resistance.
Note the levels of interest below:
- Pivot support is noted at 0.9055, 0.8992, 0.8913
- Pivot resistance is noted at 0.9198, 0.9277, 0.934
| Levels | Levels.1 |
|---|---|
| Previous Daily High | 0.9214 |
| Previous Daily Low | 0.9072 |
| Previous Weekly High | 0.9439 |
| Previous Weekly Low | 0.9175 |
| Previous Monthly High | 0.9429 |
| Previous Monthly Low | 0.9059 |
| Daily Fibonacci 38.2% | 0.9126 |
| Daily Fibonacci 61.8% | 0.9160 |
| Daily Pivot Point S1 | 0.9055 |
| Daily Pivot Point S2 | 0.8992 |
| Daily Pivot Point S3 | 0.8913 |
| Daily Pivot Point R1 | 0.9198 |
| Daily Pivot Point R2 | 0.9277 |
| Daily Pivot Point R3 | 0.9340 |
[/s2If]
Join Our Telegram Group
")


