#USDCAD @ 1.37407 clings to mild gains after bouncing off short-term key technical supports., @nehcap view: Limited upside expected (Pivot Orderbook analysis)
…
This is a premium post.
[s2If !current_user_can(access_s2member_level4)]Please register for PREMIUM VERSION HERE to read full post below containing analysis. In case of any error or you think you are not able to read the full post below, please email us at support#nehcap.com [lwa][/s2If] [s2If current_user_can(access_s2member_level4)]
- USD/CAD clings to mild gains after bouncing off short-term key technical supports.
- Convergence of 50-SMA, one-month-old ascending trend line restricts immediate downside.
- Horizontal area comprising early January lows adds to the downside filters.
- Descending resistance line from Friday, bearish MACD signals challenge Loonie pair buyers.
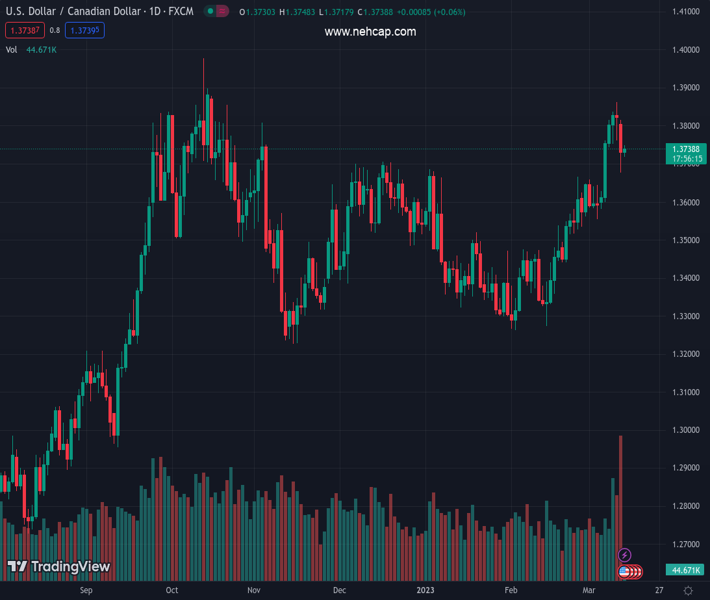
The pair currently trades last at 1.37407.
The previous day high was 1.3828 while the previous day low was 1.3677. The daily 38.2% Fib levels comes at 1.3735, expected to provide support. Similarly, the daily 61.8% fib level is at 1.377, expected to provide resistance.
USD/CAD bulls struggle to keep the latest rebound from a one-week low around 1.3750 during early Tuesday. Even so, the Loonie pair sellers have a tough road on the south before retaking control as the quote consolidates the biggest daily slump in a month.
That said, the pair bounced off early January tops the previous day, as well as portrayed a sustained recovery from the one-month-old ascending support line and the 50-SMA.
However, the bearish MACD signals and the Loonie pair’s inaction raises doubts on the quote’s further upside.
Also challenging the USD/CAD bulls is a downward-sloping resistance line from Friday, close to 1.3790 at the latest.
Even if the quote manages to remain firmer past 1.3790, it needs to remain firmer past the 1.3800 round figure ahead of challenging the monthly high surrounding 1.3860.
On the flip side, a convergence of the 50-SMA and aforementioned support line from the mid-February, around 1.3700 at the latest, appears the short-term key support for the USD/CAD sellers to watch during the quote’s pullback.
Should the quote drops below 1.3700 mark, the horizontal area comprising levels marked since early January, close to 1.3685-80, may gain the USD/CAD bear’s attention as a break of which won’t hesitate to challenge the monthly low marked in the last week around 1.3555.
Trend: Limited upside expected
Technical Levels: Supports and Resistances
USDCAD currently trading at 1.3739 at the time of writing. Pair opened at 1.3731 and is trading with a change of 0.06% % .
| Overview | Overview.1 | |
|---|---|---|
| 0 | Today last price | 1.3739 |
| 1 | Today Daily Change | 0.0008 |
| 2 | Today Daily Change % | 0.06% |
| 3 | Today daily open | 1.3731 |
The pair remains strongly bullish on the daily timeframe. It trades above its 20 SMA @ 1.3596, 50 SMA 1.3483, 100 SMA @ 1.3504 and 200 SMA @ 1.3319.
| Trends | Trends.1 | |
|---|---|---|
| 0 | Daily SMA20 | 1.3596 |
| 1 | Daily SMA50 | 1.3483 |
| 2 | Daily SMA100 | 1.3504 |
| 3 | Daily SMA200 | 1.3319 |
The previous day high was 1.3828 while the previous day low was 1.3677. The daily 38.2% Fib levels comes at 1.3735, expected to provide support. Similarly, the daily 61.8% fib level is at 1.377, expected to provide resistance.
Note the levels of interest below:
- Pivot support is noted at 1.3663, 1.3594, 1.3512
- Pivot resistance is noted at 1.3814, 1.3896, 1.3964
| Levels | Levels.1 |
|---|---|
| Previous Daily High | 1.3828 |
| Previous Daily Low | 1.3677 |
| Previous Weekly High | 1.3862 |
| Previous Weekly Low | 1.3582 |
| Previous Monthly High | 1.3666 |
| Previous Monthly Low | 1.3262 |
| Daily Fibonacci 38.2% | 1.3735 |
| Daily Fibonacci 61.8% | 1.3770 |
| Daily Pivot Point S1 | 1.3663 |
| Daily Pivot Point S2 | 1.3594 |
| Daily Pivot Point S3 | 1.3512 |
| Daily Pivot Point R1 | 1.3814 |
| Daily Pivot Point R2 | 1.3896 |
| Daily Pivot Point R3 | 1.3964 |
[/s2If]
Join Our Telegram Group
")


