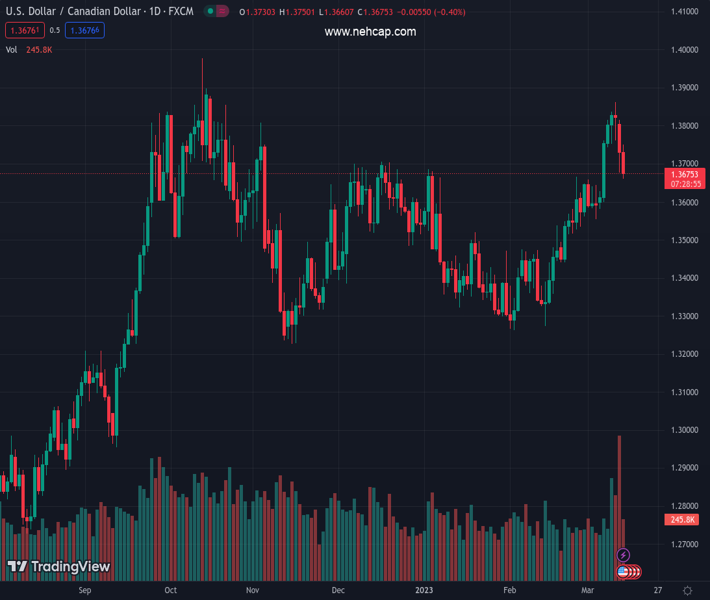
#USDCAD @ 1.36762 drifts lower for the third straight day and drops to a one-week low on Tuesday. (Pivot Orderbook analysis)
…
This is a premium post.
[s2If !current_user_can(access_s2member_level4)]Please register for PREMIUM VERSION HERE to read full post below containing analysis. In case of any error or you think you are not able to read the full post below, please email us at support#nehcap.com [lwa][/s2If] [s2If current_user_can(access_s2member_level4)]
- USD/CAD drifts lower for the third straight day and drops to a one-week low on Tuesday.
- The USD surrenders its modest gains in reaction to the US CPI report and exerts pressure.
- Bearish Crude Oil prices could undermine the Loonie and help limit any further downside.
The pair currently trades last at 1.36762.
The previous day high was 1.3828 while the previous day low was 1.3677. The daily 38.2% Fib levels comes at 1.3735, expected to provide resistance. Similarly, the daily 61.8% fib level is at 1.377, expected to provide resistance.
The USD/CAD pair extends its recent pullback from the 1.3860 area, or its highest level since October 2022, and remains under some selling pressure for the third successive day on Tuesday. The intraday downfall picks up pace following the release of the US consumer inflation figures and drags spot prices to a one-week low, around the 1.3660 region during the early North American session.
The US Bureau of Labor Statistics reported that the headline CPI rose by 0.4% in February as compared to the 0.5% recorded in the previous month and the yearly rate decelerated from 6.4% to 6.0%. The data reaffirm market expectations that the Federal Reserve could slow, or even pause its rate-hiking cycle in the wake of the strain on the US banking system, which, in turn, exerts some pressure on the US Dollar and turns out to be a key factor weighing on the USD/CAD pair.
That said, the Core CPI, which excludes volatile food and energy prices, came in at 0.5% on a monthly basis, beating estimates for a reading of 0.4%. Apart from this, easing fears of a broader systemic crisis and the risk-on impulse remain supportive of an intraday rally in the US Treasury bond yields, which lends some support to the Greenback. Furthermore, bearish Crude Oil prices undermine the commodity-linked Loonie and might act as a tailwind for the USD/CAD pair.
This, along with the fact that the Bank of Canada (BoC) became the first major central bank to pause its rate-hiking cycle last week, supports prospects for the emergence of some dip-buying around the USD/CAD pair. Hence, it will be prudent to wait for strong follow-through selling before confirming that the recent positive move witnessed over the past month or so has run its course and positioning for any meaningful corrective decline for the major.
Technical Levels: Supports and Resistances
USDCAD currently trading at 1.3681 at the time of writing. Pair opened at 1.3731 and is trading with a change of -0.36 % .
| Overview | Overview.1 | |
|---|---|---|
| 0 | Today last price | 1.3681 |
| 1 | Today Daily Change | -0.0050 |
| 2 | Today Daily Change % | -0.3600 |
| 3 | Today daily open | 1.3731 |
The pair remains strongly bullish on the daily timeframe. It trades above its 20 SMA @ 1.3596, 50 SMA 1.3483, 100 SMA @ 1.3504 and 200 SMA @ 1.3319.
| Trends | Trends.1 | |
|---|---|---|
| 0 | Daily SMA20 | 1.3596 |
| 1 | Daily SMA50 | 1.3483 |
| 2 | Daily SMA100 | 1.3504 |
| 3 | Daily SMA200 | 1.3319 |
The previous day high was 1.3828 while the previous day low was 1.3677. The daily 38.2% Fib levels comes at 1.3735, expected to provide resistance. Similarly, the daily 61.8% fib level is at 1.377, expected to provide resistance.
Note the levels of interest below:
- Pivot support is noted at 1.3663, 1.3594, 1.3512
- Pivot resistance is noted at 1.3814, 1.3896, 1.3964
| Levels | Levels.1 |
|---|---|
| Previous Daily High | 1.3828 |
| Previous Daily Low | 1.3677 |
| Previous Weekly High | 1.3862 |
| Previous Weekly Low | 1.3582 |
| Previous Monthly High | 1.3666 |
| Previous Monthly Low | 1.3262 |
| Daily Fibonacci 38.2% | 1.3735 |
| Daily Fibonacci 61.8% | 1.3770 |
| Daily Pivot Point S1 | 1.3663 |
| Daily Pivot Point S2 | 1.3594 |
| Daily Pivot Point S3 | 1.3512 |
| Daily Pivot Point R1 | 1.3814 |
| Daily Pivot Point R2 | 1.3896 |
| Daily Pivot Point R3 | 1.3964 |
[/s2If]
Join Our Telegram Group
")


