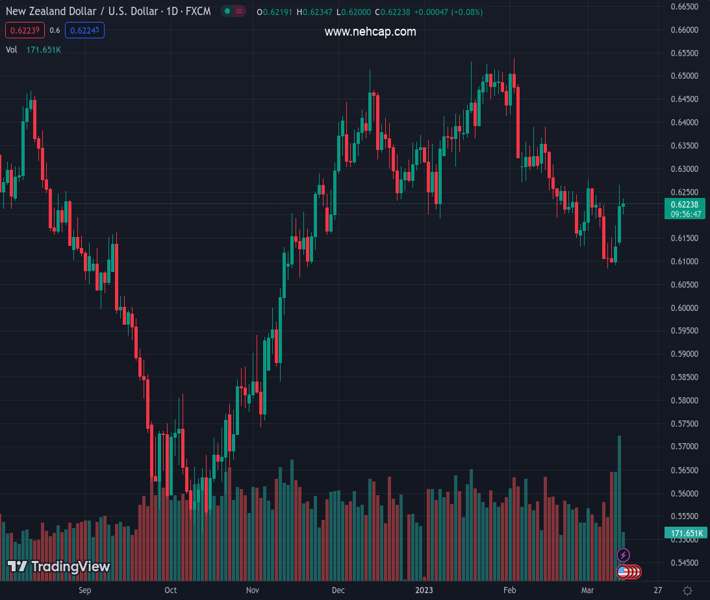
#NZDUSD @ 0.62221 seesaws between tepid gains/minor losses through the first half of the European session. (Pivot Orderbook analysis)
…
This is a premium post.
[s2If !current_user_can(access_s2member_level4)]Please register for PREMIUM VERSION HERE to read full post below containing analysis. In case of any error or you think you are not able to read the full post below, please email us at support#nehcap.com [lwa][/s2If] [s2If current_user_can(access_s2member_level4)]
- NZD/USD seesaws between tepid gains/minor losses through the first half of the European session.
- A positive risk tone benefits the risk-sensitive Kiwi; resurgent USD demand caps gains for the major.
- Traders now look forward to the US CPI report for some impetus ahead of the FOMC on Wednesday.
The pair currently trades last at 0.62221.
The previous day high was 0.6265 while the previous day low was 0.6131. The daily 38.2% Fib levels comes at 0.6214, expected to provide support. Similarly, the daily 61.8% fib level is at 0.6182, expected to provide support.
The NZD/USD pair struggles to gain any meaningful traction on Tuesday and oscillates in a narrow trading band through the first half of the European session. Spot prices, however, manage to hold above the 0.6200 mark and remain well below a nearly two-week high, around the 0.6265 region, touched the previous day.
A goodish intraday rally in the US Treasury bond yields helps revive the US Dollar demand, which, in turn, is seen as a key factor acting as a headwind for the NZD/USD pair. That said, a generally positive tone around the equity markets, bolstered by easing fears of a broader systemic crisis, lends some support to the risk-sensitive Kiwi and limits the downside for the major. Traders also seem reluctant to place aggressive bets and prefer to wait on the sidelines ahead of the release of the US consumer inflation figures, due later during the early North American session.
The crucial US CPI report might influence expectations about the Fed’s future rate hike path, which, in turn, will play a key role in driving the USD demand and provide a fresh directional impetus to the NZD/USD pair. The markets have been speculating that the Fed could slow, if not halt, its rate-hiking cycle, in the wake of the strain on the US banking system. That said, a stronger US CPI print will lift bets for a more aggressive policy tightening by the Fed and boost the USD ahead of the key central bank event risk – the outcome of a two-day FOMC meeting on Wednesday.
Nevertheless, the important US macro data should infuse some volatility in the financial markets and allow traders to grab short-term opportunities around the NZD/USD pair. The intraday price action, meanwhile, warrants some caution before confirming that spot prices have formed a near-term bottom and positioning for an extension of the recent recovery move from sub-0.6100 levels, or the YTD low touched last week.
Technical Levels: Supports and Resistances
NZDUSD currently trading at 0.6216 at the time of writing. Pair opened at 0.622 and is trading with a change of -0.06 % .
| Overview | Overview.1 | |
|---|---|---|
| 0 | Today last price | 0.6216 |
| 1 | Today Daily Change | -0.0004 |
| 2 | Today Daily Change % | -0.0600 |
| 3 | Today daily open | 0.6220 |
The pair is trading above its 20 Daily moving average @ 0.6206, below its 50 Daily moving average @ 0.6317 , below its 100 Daily moving average @ 0.6245 and above its 200 Daily moving average @ 0.6167
| Trends | Trends.1 | |
|---|---|---|
| 0 | Daily SMA20 | 0.6206 |
| 1 | Daily SMA50 | 0.6317 |
| 2 | Daily SMA100 | 0.6245 |
| 3 | Daily SMA200 | 0.6167 |
The previous day high was 0.6265 while the previous day low was 0.6131. The daily 38.2% Fib levels comes at 0.6214, expected to provide support. Similarly, the daily 61.8% fib level is at 0.6182, expected to provide support.
Note the levels of interest below:
- Pivot support is noted at 0.6145, 0.6071, 0.6011
- Pivot resistance is noted at 0.628, 0.6339, 0.6414
| Levels | Levels.1 |
|---|---|
| Previous Daily High | 0.6265 |
| Previous Daily Low | 0.6131 |
| Previous Weekly High | 0.6226 |
| Previous Weekly Low | 0.6084 |
| Previous Monthly High | 0.6538 |
| Previous Monthly Low | 0.6131 |
| Daily Fibonacci 38.2% | 0.6214 |
| Daily Fibonacci 61.8% | 0.6182 |
| Daily Pivot Point S1 | 0.6145 |
| Daily Pivot Point S2 | 0.6071 |
| Daily Pivot Point S3 | 0.6011 |
| Daily Pivot Point R1 | 0.6280 |
| Daily Pivot Point R2 | 0.6339 |
| Daily Pivot Point R3 | 0.6414 |
[/s2If]
Join Our Telegram Group
")


