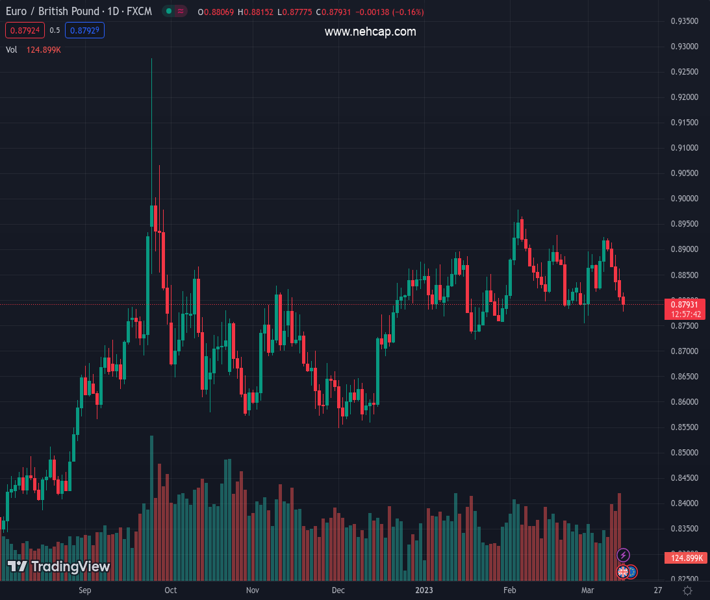
#EURGBP @ 0.87928 drifts lower for the fifth straight day and drops to a nearly two-week low on Tuesday. (Pivot Orderbook analysis)
…
This is a premium post.
[s2If !current_user_can(access_s2member_level4)]Please register for PREMIUM VERSION HERE to read full post below containing analysis. In case of any error or you think you are not able to read the full post below, please email us at support#nehcap.com [lwa][/s2If] [s2If current_user_can(access_s2member_level4)]
- EUR/GBP drifts lower for the fifth straight day and drops to a nearly two-week low on Tuesday.
- The GBP’s relative outperformance comes amid rising bets for additional rate hikes by the BoE.
- The mixed UK jobs data fails to push back against hawkish BoE expectations or lend any support.
- Speculations for more jumbo rate hikes by the ECB warrant caution for aggressive bearish traders.
The pair currently trades last at 0.87928.
The previous day high was 0.8864 while the previous day low was 0.8799. The daily 38.2% Fib levels comes at 0.8824, expected to provide resistance. Similarly, the daily 61.8% fib level is at 0.8839, expected to provide resistance.
The EUR/GBP cross remains under some selling pressure for the fifth successive day on Tuesday and drops to a nearly two-week low during the early European session. The selling bias remains unabated following the release of the mixed UK monthly employment details and drags spot prices below the 0.8800 mark, with bears now eyeing to challenge a technically significant 100-day Simple Moving Average (SMA).
In fact, the UK Office for National Statistics reported that the number of people claiming unemployment-related benefits fell by 11.2K in February, less than the 12.4 decline anticipated. The slight disappointment, however, was offset by a sharp downward revision of the previous month’s reading to show a drop of 30.3K in the Claimant Count Change against the 12.9 fall estimated. Furthermore, the jobless rate held steady at 3.7% during the three months to January as compared to a modest uptick to 3.8%, while the rolling three-month average indicated that the UK wages are cooling. Nevertheless, the data is strong enough to allow the Bank of England (BoE) to hike interest rates again later this month, which continues to underpin the British Pound and exerts downward pressure on the EUR/GBP cross.
Apart from this, a goodish pickup in the US Dollar demand is seen weighing on the shared currency, which further contributes to the heavily offered tone surrounding the EUR/GBP cross. That said, the recent hawkish comments by several European Central Bank (ECB) officials, stressing the need for more interest rate hikes beyond March, could lend some support to the Euro. Traders might also refrain from placing aggressive bearish bets ahead of the ECB monetary policy meeting, scheduled on Thursday. The focus will then shift to the BoE meeting next week, which should help determine the next leg of a directional move for the cross. Hence, any subsequent decline is more likely to find decent support near the 100-day SMA, which should act as a pivotal point ahead of the key central bank event risks.
Technical Levels: Supports and Resistances
EURGBP currently trading at 0.8787 at the time of writing. Pair opened at 0.8809 and is trading with a change of -0.25 % .
| Overview | Overview.1 | |
|---|---|---|
| 0 | Today last price | 0.8787 |
| 1 | Today Daily Change | -0.0022 |
| 2 | Today Daily Change % | -0.2500 |
| 3 | Today daily open | 0.8809 |
The pair is trading below its 20 Daily moving average @ 0.885, below its 50 Daily moving average @ 0.8839 , above its 100 Daily moving average @ 0.8766 and above its 200 Daily moving average @ 0.8679
| Trends | Trends.1 | |
|---|---|---|
| 0 | Daily SMA20 | 0.8850 |
| 1 | Daily SMA50 | 0.8839 |
| 2 | Daily SMA100 | 0.8766 |
| 3 | Daily SMA200 | 0.8679 |
The previous day high was 0.8864 while the previous day low was 0.8799. The daily 38.2% Fib levels comes at 0.8824, expected to provide resistance. Similarly, the daily 61.8% fib level is at 0.8839, expected to provide resistance.
Note the levels of interest below:
- Pivot support is noted at 0.8784, 0.8759, 0.872
- Pivot resistance is noted at 0.8849, 0.8888, 0.8913
| Levels | Levels.1 |
|---|---|
| Previous Daily High | 0.8864 |
| Previous Daily Low | 0.8799 |
| Previous Weekly High | 0.8925 |
| Previous Weekly Low | 0.8821 |
| Previous Monthly High | 0.8979 |
| Previous Monthly Low | 0.8755 |
| Daily Fibonacci 38.2% | 0.8824 |
| Daily Fibonacci 61.8% | 0.8839 |
| Daily Pivot Point S1 | 0.8784 |
| Daily Pivot Point S2 | 0.8759 |
| Daily Pivot Point S3 | 0.8720 |
| Daily Pivot Point R1 | 0.8849 |
| Daily Pivot Point R2 | 0.8888 |
| Daily Pivot Point R3 | 0.8913 |
[/s2If]
Join Our Telegram Group
")


