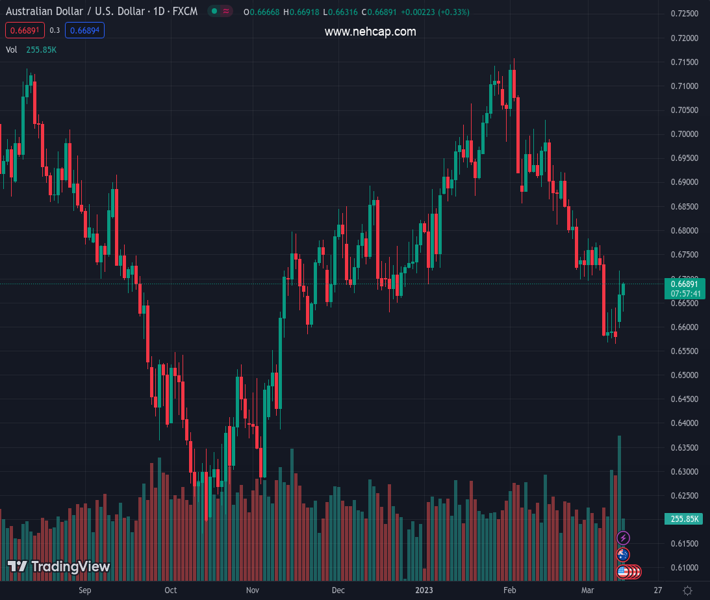
#AUDUSD @ 0.66867 struggles to capitalize on its modest intraday bounce from the 0.6630 area. (Pivot Orderbook analysis)
…
This is a premium post.
[s2If !current_user_can(access_s2member_level4)]Please register for PREMIUM VERSION HERE to read full post below containing analysis. In case of any error or you think you are not able to read the full post below, please email us at support#nehcap.com [lwa][/s2If] [s2If current_user_can(access_s2member_level4)]
- AUD/USD struggles to capitalize on its modest intraday bounce from the 0.6630 area.
- Rebounding US bond yields continues to underpin the USD and cap gains for the pair.
- The latest US consumer inflation figures do little to provide any impetus to the major.
The pair currently trades last at 0.66867.
The previous day high was 0.6717 while the previous day low was 0.6579. The daily 38.2% Fib levels comes at 0.6664, expected to provide support. Similarly, the daily 61.8% fib level is at 0.6632, expected to provide support.
The AUD/USD pair reverses an early North American session dip and climbs to a fresh daily peak following the release of the latest US consumer inflation figures. Spot prices, however, struggle to capitalize on the modest intraday uptick and remain below the 0.6700 round-figure mark, at least for the time being.
The US Dollar comes under some selling pressure after the US Bureau of Labor Statistics reported that the headline CPI rose by 0.4% in February as compared to the 0.5% recorded in the previous month. Adding to this, the yearly rate decelerated from 6.4% to 6.0% during the reported month. The data reaffirms expectations that the Federal Reserve will slow, if not halt, its rate-hiking cycle amid the strain on the US banking system, which, in turn, weighs on the Greenback and lends support to the AUD/USD pair.
That said, the Core CPI, which excludes volatile food and energy prices, came in at 0.5% on a monthly basis, beating estimates for a reading of 0.4%. This comes on the back of easing fears of a broader systemic crisis, which remains supportive of a strong intraday rally in the US Treasury bond yields and helps limit the downside for the USD. Apart from this, the Reserve Bank of Australia’s (RBA) recent dovish shift, signalling that it might be nearing the end of its rate-hiking cycle, contributes to capping the AUD/USD pair.
Hence, it will be prudent to wait for a sustained strength above the 0.6700 mark and a subsequent move beyond the overnight swing high, around the 0.6715 region, before placing fresh bullish bets around the AUD/USD pair. Moreover, the lack of any meaningful buying warrants some caution before confirming that spot prices have bottomed out in the near term and that the recent downfall witnessed since early February has run its course.
Technical Levels: Supports and Resistances
AUDUSD currently trading at 0.6673 at the time of writing. Pair opened at 0.6667 and is trading with a change of 0.09 % .
| Overview | Overview.1 | |
|---|---|---|
| 0 | Today last price | 0.6673 |
| 1 | Today Daily Change | 0.0006 |
| 2 | Today Daily Change % | 0.0900 |
| 3 | Today daily open | 0.6667 |
The pair remains strongly bearish on the daily time frame. It trades below the 20 SMA @ 0.6762, 50 SMA 0.6882, 100 SMA @ 0.6768 and 200 SMA @ 0.6775.
| Trends | Trends.1 | |
|---|---|---|
| 0 | Daily SMA20 | 0.6762 |
| 1 | Daily SMA50 | 0.6882 |
| 2 | Daily SMA100 | 0.6768 |
| 3 | Daily SMA200 | 0.6775 |
The previous day high was 0.6717 while the previous day low was 0.6579. The daily 38.2% Fib levels comes at 0.6664, expected to provide support. Similarly, the daily 61.8% fib level is at 0.6632, expected to provide support.
Note the levels of interest below:
- Pivot support is noted at 0.6592, 0.6516, 0.6454
- Pivot resistance is noted at 0.673, 0.6792, 0.6868
| Levels | Levels.1 |
|---|---|
| Previous Daily High | 0.6717 |
| Previous Daily Low | 0.6579 |
| Previous Weekly High | 0.6770 |
| Previous Weekly Low | 0.6564 |
| Previous Monthly High | 0.7158 |
| Previous Monthly Low | 0.6698 |
| Daily Fibonacci 38.2% | 0.6664 |
| Daily Fibonacci 61.8% | 0.6632 |
| Daily Pivot Point S1 | 0.6592 |
| Daily Pivot Point S2 | 0.6516 |
| Daily Pivot Point S3 | 0.6454 |
| Daily Pivot Point R1 | 0.6730 |
| Daily Pivot Point R2 | 0.6792 |
| Daily Pivot Point R3 | 0.6868 |
[/s2If]
Join Our Telegram Group
")


